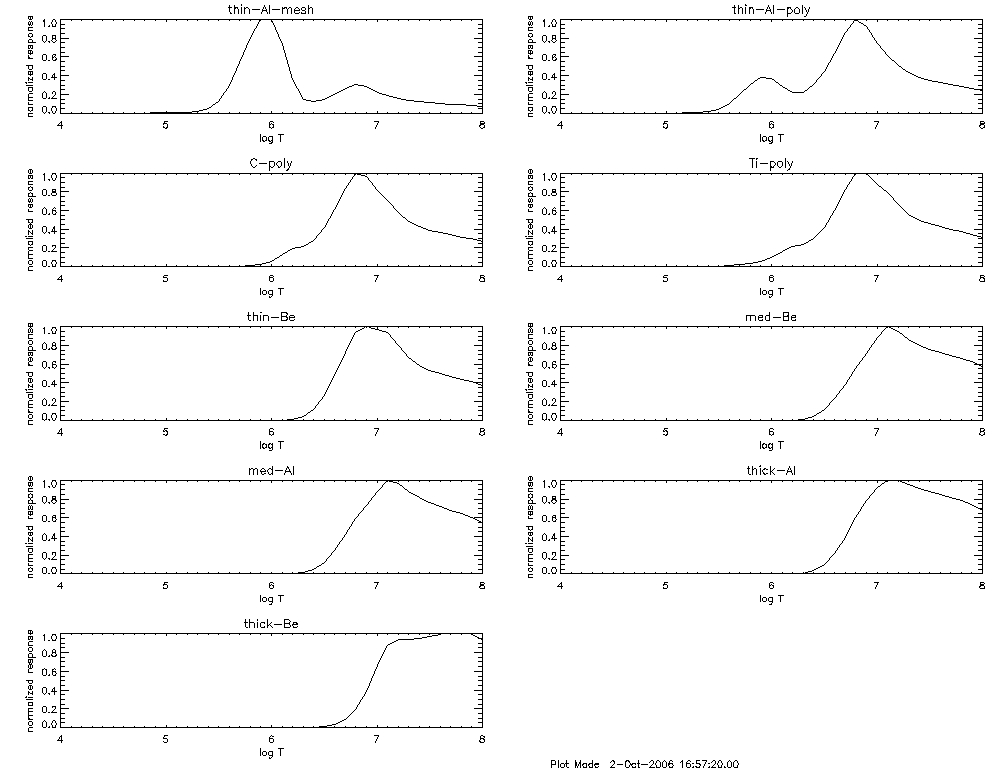
temperature responses,
normalized |
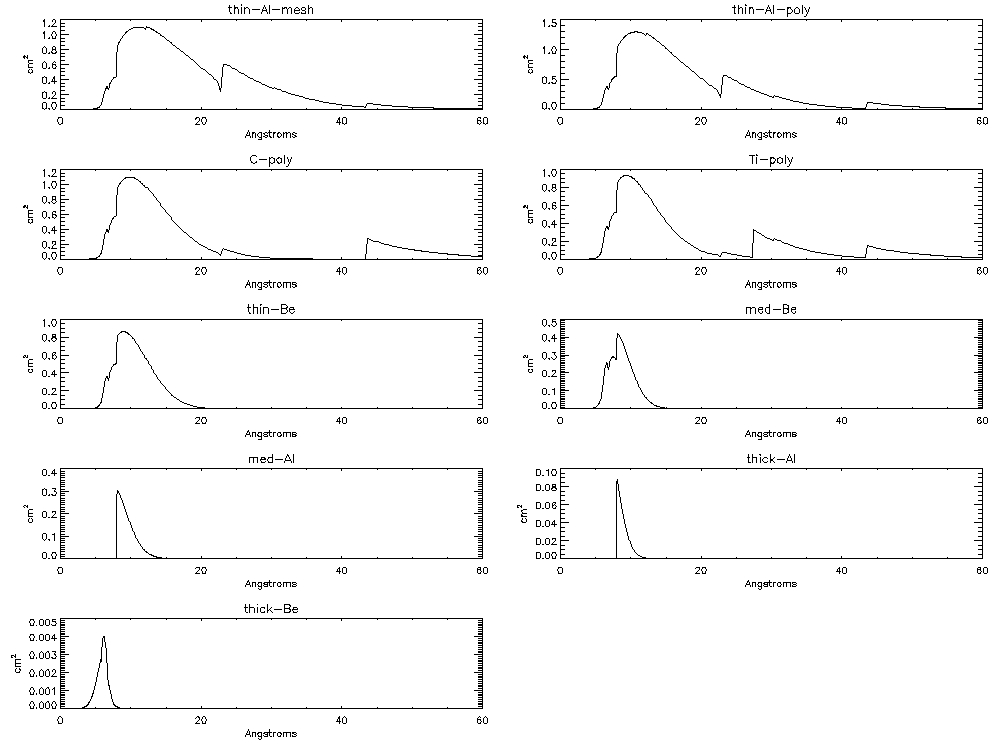
effective area as a function of
wavelength |
These 2 graphs are intended to be used as a guide to the sensitivity of XRT through its various analysis filters. When choosing a set of filters for a given observation, probably the temperature response curves will be most useful.
temperature responses,
normalized |
effective area as a function of
wavelength |
Estimated signal rate (electrons/s/pixel) from the XRT CCD for varoius observing regions on the Sun, for each of the analysis filters.
| Observing Region | Thin Al/Mesh | Thin Al/Poly | C/Poly | Ti/Poly | Thin Be | Med Be | Med Al | Thick Al | Thick Be | Visible Light |
| Quiet Sun | 3.5 e 3 | 1.2 e 3 | 6.2 e 2 | 5.1 e 2 | 2.0 e 2 | 33 | 16 | 2.0 | 0.066 | 2.0 e 6 |
| AR (low activity) | 3.9 e 5 | 3.2 e 5 | 1.9 e 5 | 1.4 e 5 | 6.8 e 4 | 9.6 e 3 | 4.8 e 3 | 5.8 e 2 | 13 | |
| AR (high activity) | 2.3 e 6 | 2.4 e 6 | 1.6 e 6 | 1.2 e 6 | 7.8 e 5 | 1.3 e 5 | 6.2 e 4 | 7.8 e 3 | 2.3 e 2 | |
| Flare (M2) | 5.2 e 8 | 5.9 e 8 | 4.4 e 8 | 3.4 e 8 | 2.5 e 8 | 5.6 e 7 | 2.6 e 7 | 3.5 e 6 | 1.6 e 5 |
Estimated exposure time (ms) for the CCD to generate 75k electrons/pixel (about half of the full well capacity of an image area pixel).
| Observing Region | Thin Al/Mesh | Thin Al/Poly | C/Poly | Ti/Poly | Thin Be | Med Be | Med Al | Thick Al | Thick Be | Visible Light |
| Quiet Sun | 2.2 e 4 | 6.0 e 4 | 1.2 e 5 | 1.5 e 5 | 3.7 e 5 | 2.3 e 6 | 4.7 e 6 | 3.7 e 7 | 1.1 e 9 | 38 |
| AR (low activity) | 1.9 e 2 | 2.4 e 2 | 4.0 e 2 | 5.4 e 2 | 1.1 e 3 | 7.8 e 3 | 1.6 e 4 | 1.3 e 5 | 5.7 e 6 | |
| AR (high activity) | 33 | 31 | 46 | 63 | 96 | 5.8 e 2 | 1.2 e 3 | 9.6 e 3 | 3.3 e 5 | |
| Flare (M2) | 0.14 | 0.13 | 0.17 | 0.22 | 0.30 | 1.3 | 2.9 | 21 | 4.8 e 2 |
