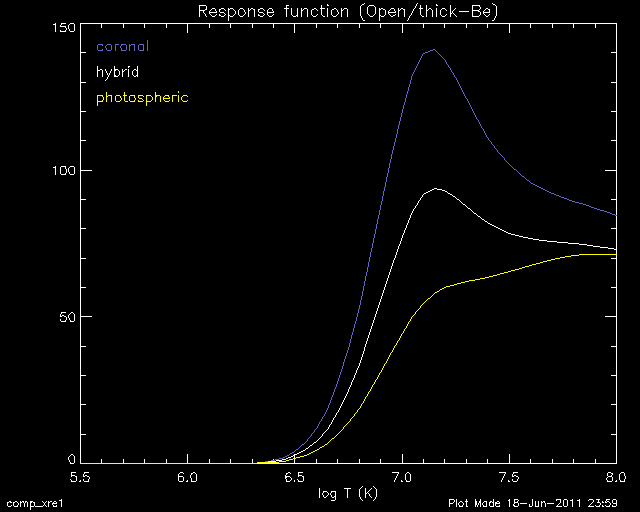
XRT temperature response with other choice of abundances.
(April, 2011 by Aki Takeda)
(June, 2011 revised.)
1. Introduction.
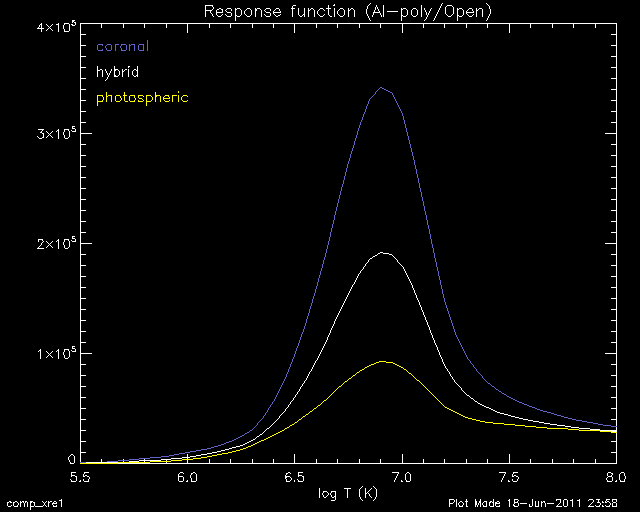
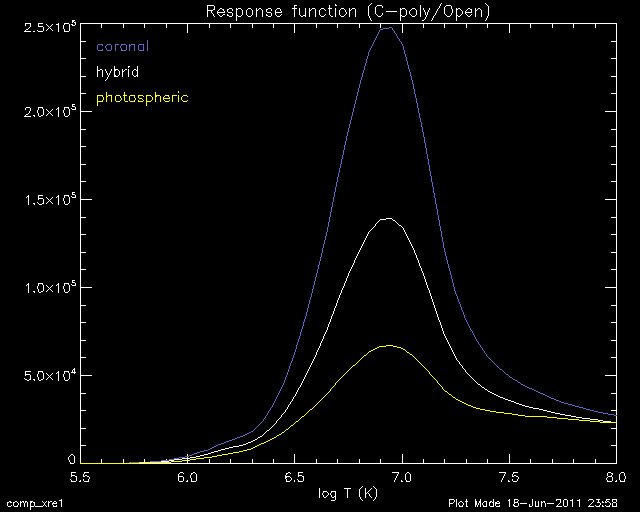
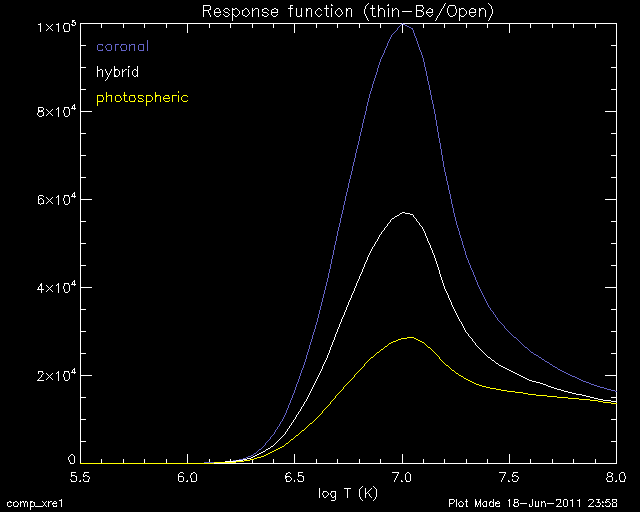
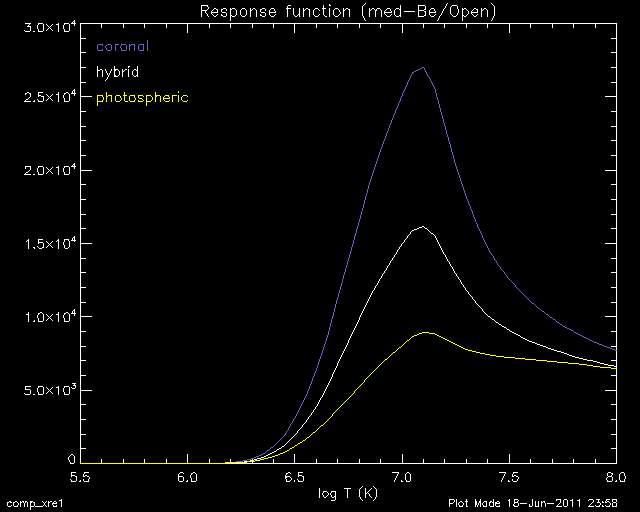
Current official XRT temperature response assumes coronal abundance,
and calculated with Chianti 6.01. However, the temperature responses
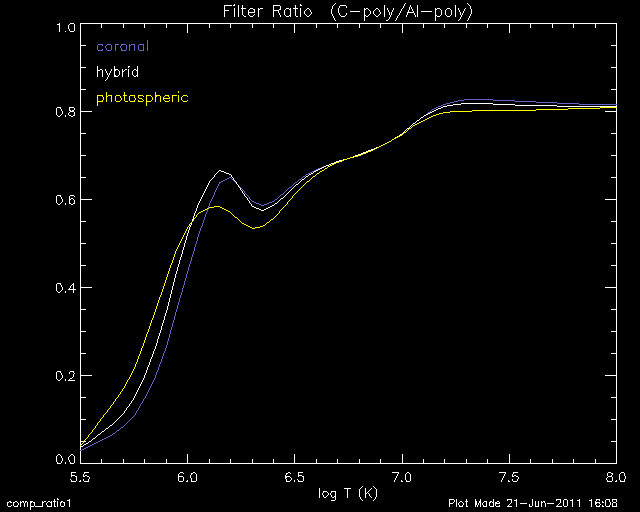
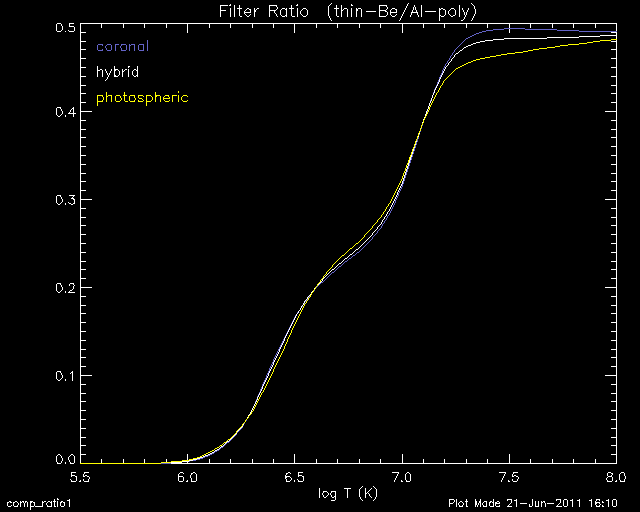
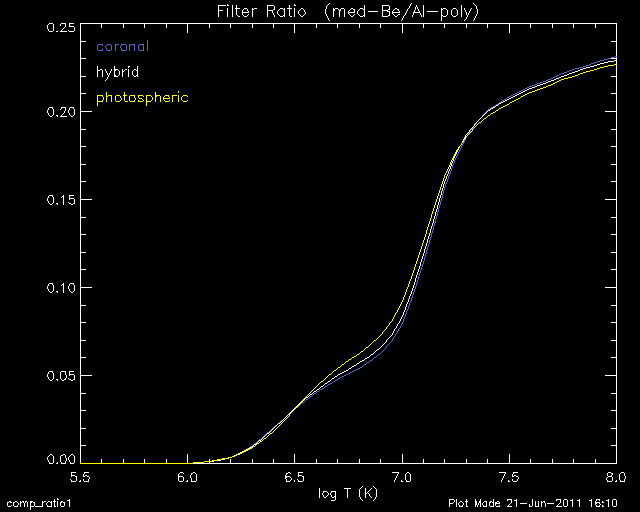
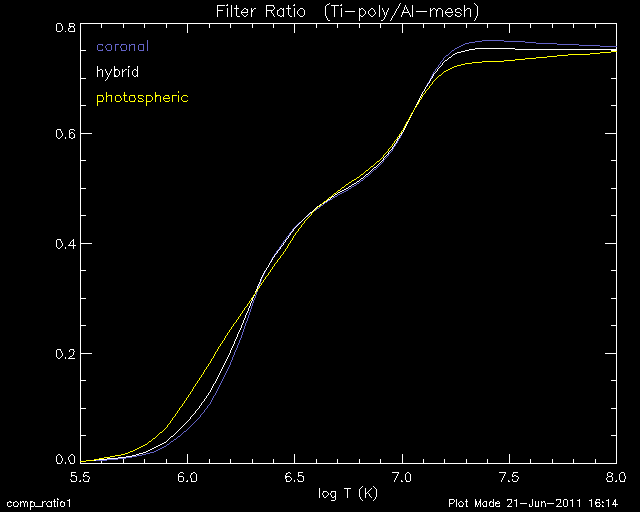
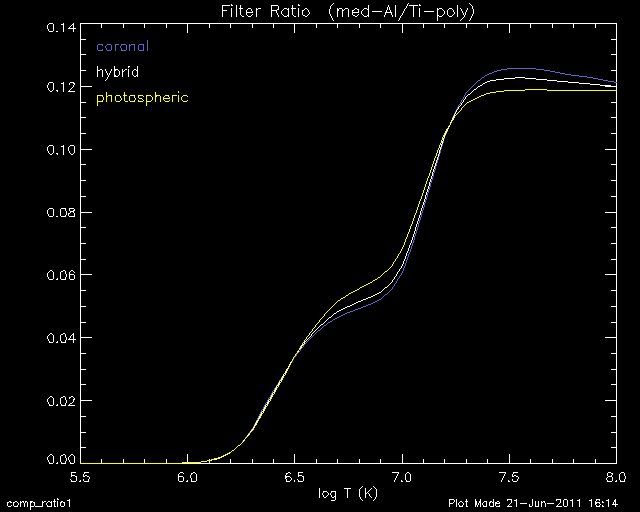
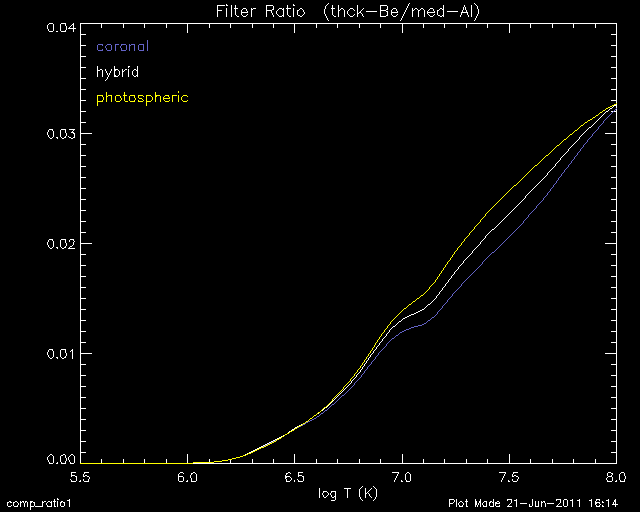
and the resulting filter ratios are affected by the choice of abundance.
2. The response functions with other abundance.
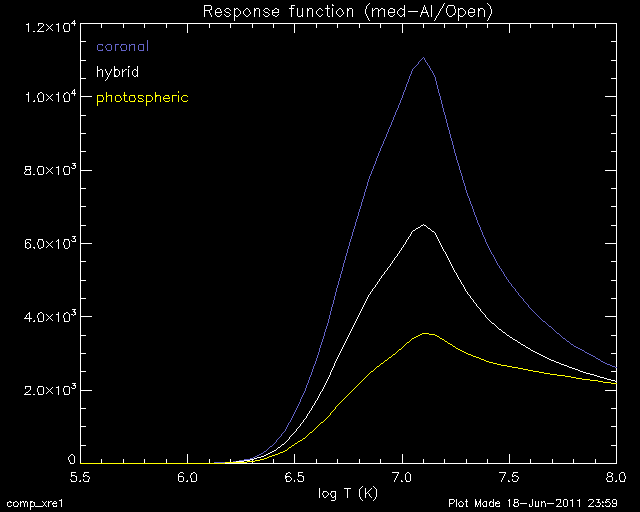
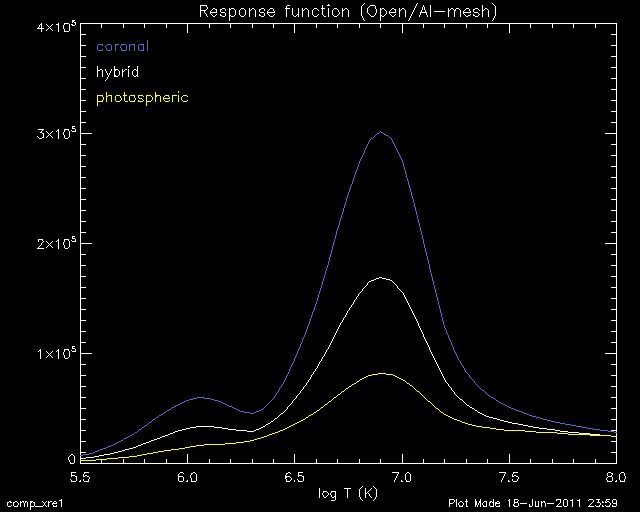
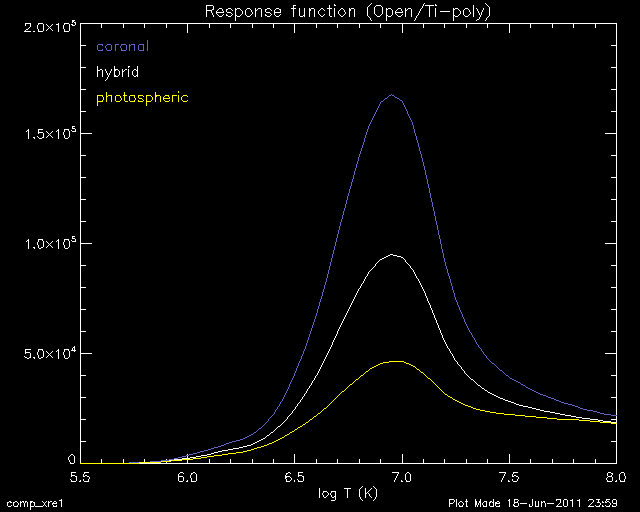
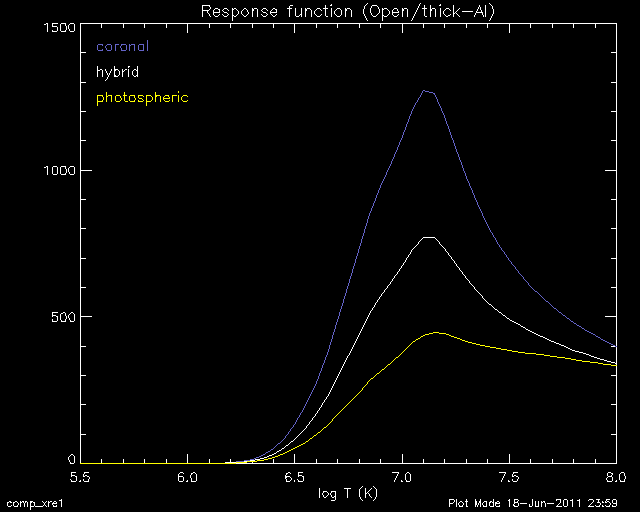
Using same approach as SXT response, calculate the XRT response
with the 'hybrid' and 'photospheric' abundances.
- (a) sun_coronal_ext.abund + chianti.ioneq (xre_ch601_corona_chianti.genx)
- (b) sun_hybrid_ext.abund + chianti.ioneq (xre_ch601_hybrid_chianti.genx)
- (c) sun_photospheric_grevesse07.abund' + chianti.ioneq (xre_ch601_photos_chianti.genx)
| Al-poly/Open | C-poly/Open | thin-Be/Open |
med-Be/Open | med-Al/Open |
 |
 |
 |
 |
 |
| Open/Al-mesh | Open/Ti-poly | Open/thick-Al |
Open/thick-Be |
 |
 |
 |
 |
|
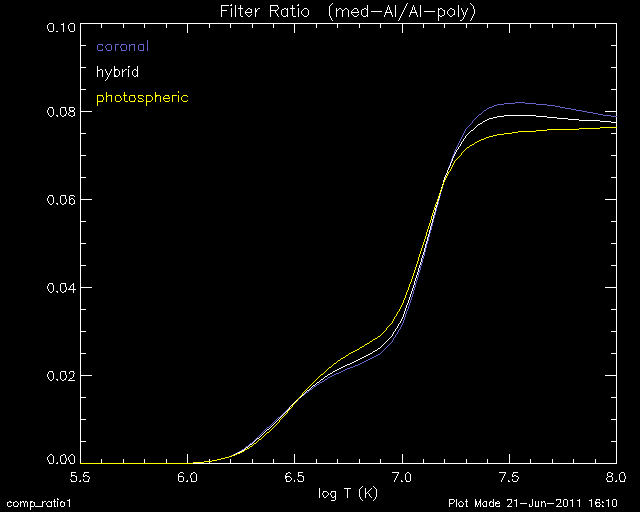
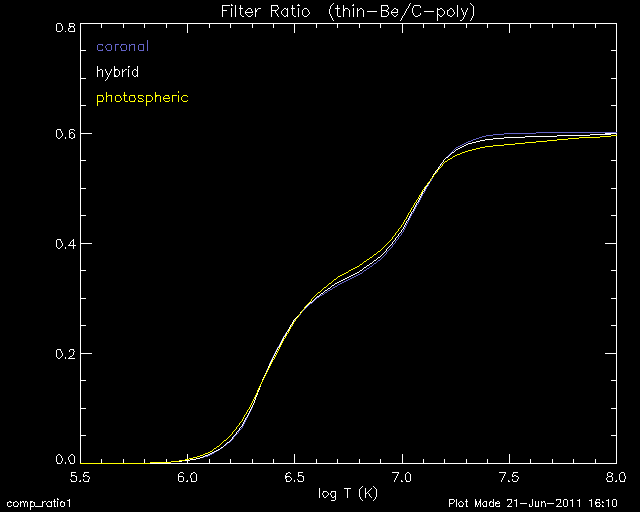
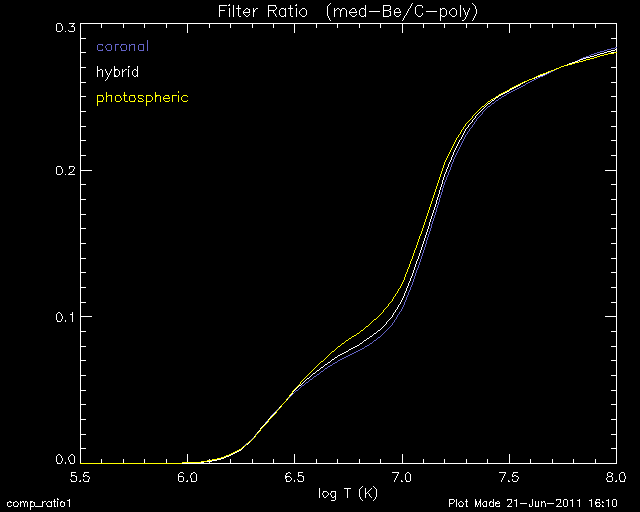
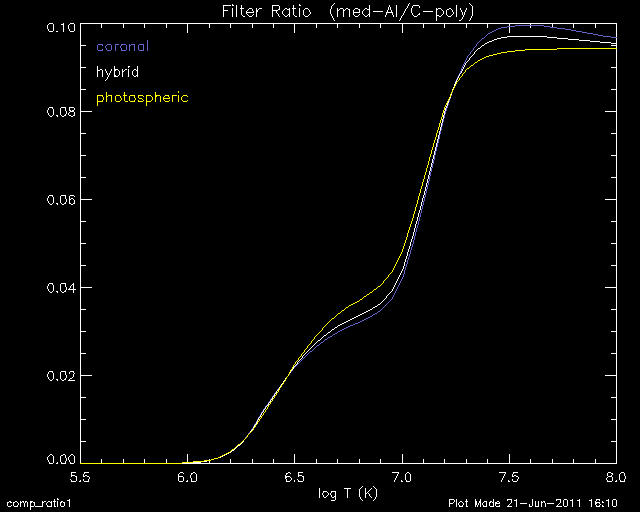
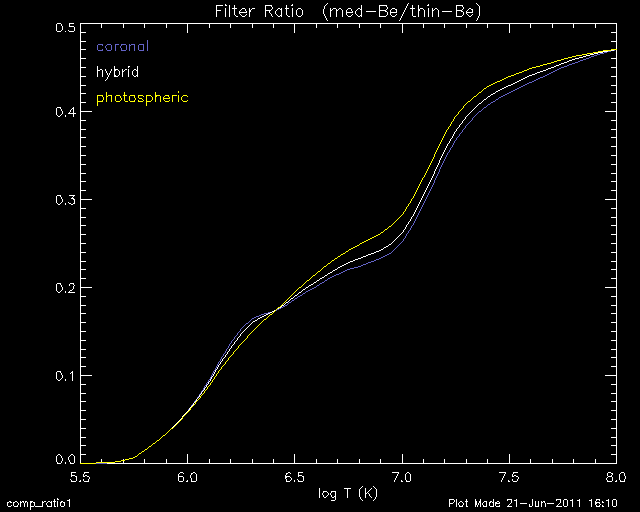
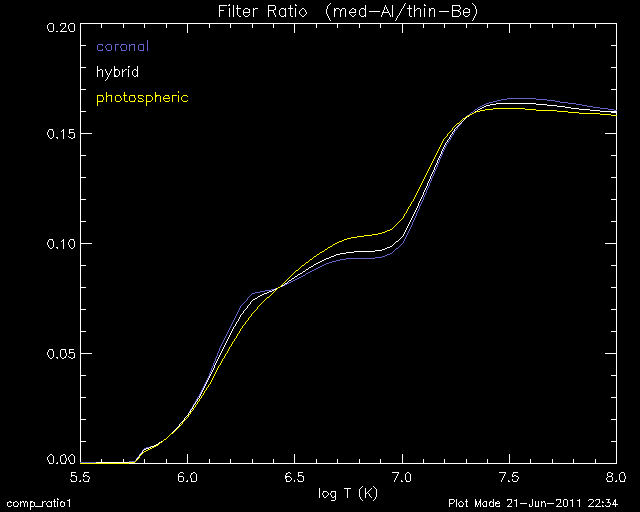
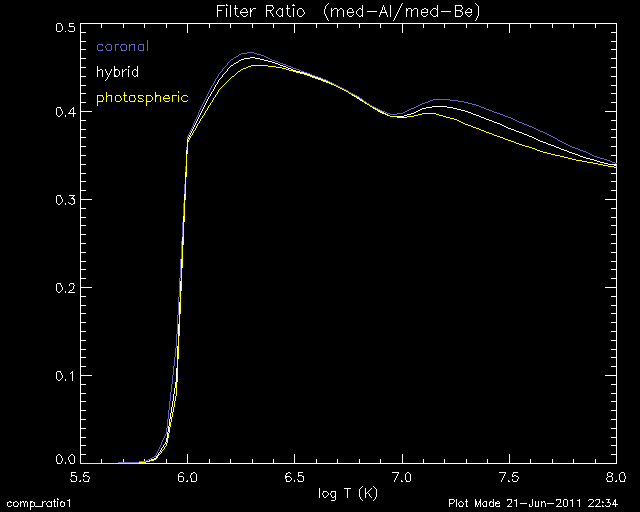
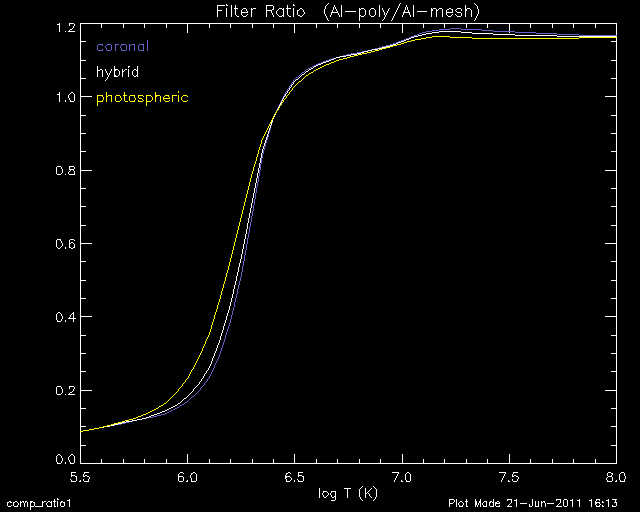
Line ratios of the filter pairs.
| C-poly/Al-poly | thin-Be/Al-poly | med-Be/Al-poly |
med-Al/Al-poly | thin-Be/C-poly |
 |
 |
 |
 |
 |
| med-Be/C-poly | med-Al/C-poly | med-Be/thin-Be |
med-Al/thin-Be | med-Al/med-Be |
 |
 |
 |
 |
 |
| Al-poly/Al-mesh | Ti-poly/Al-mesh | med-Al/Ti-poly |
thick-Be/med-Al | |
 |
 |
 |
 |
|
3. Test analysis of an active region (AR10923).
AR10923 : observed 12-Nov-2006
in all FW1 filters, i.e., Al-poly, C-poly, thin-Be, med-Be, and med-Al
(all with FW2 is Open).
This region was studied in the following papers.
- Reale et al. (2007) Science, 318, p.1582
- Reale et al. (2009) ApJ, 698, p.756
- Parenti, Reale, and Reeves (2010) A&A 517, A41
Figures from Reale et al. (2009).
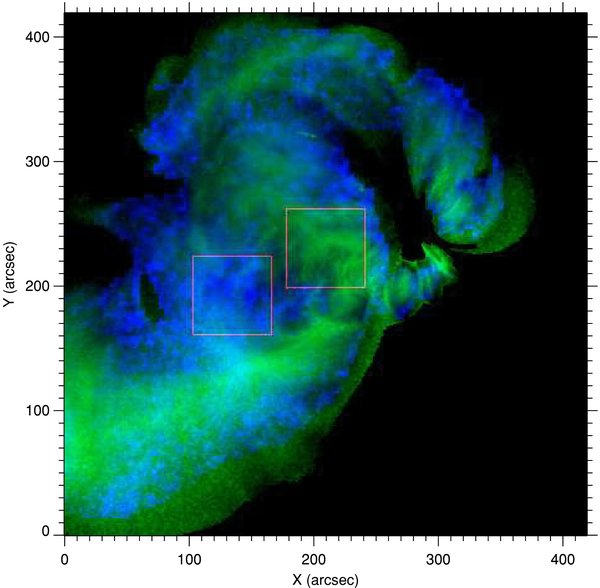
[left]
Maps of temperature as in Figure 2 obtained with CIFR (green scale) and hard (F4/F5) filter ratio (blue scale). The red boxes mark the regions of different temperature regimes analyzed separately: the one on the left is hotter in the hard filter ratio (hereafter hard-hot region), and the one on the right is hotter in the soft filter ratios (hereafter soft-hot region).
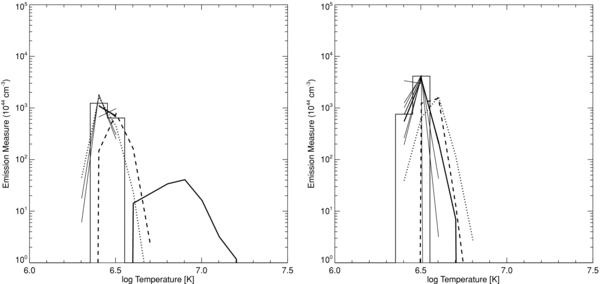
[right]
Emission measure distributions vs. temperature for the hard-hot (left) and soft-hot (right) subregions marked in the temperature map.
soft filter ratios (thin solid lines), CIFR (histogram), F5/F3 (dotted line), F4/F3 (dashed line), F4/F5 (thick solid line). The latter is obtained from the map binned over boxes of 4x4 pixels.
The analysis so far I made.
- Get data for 12-Nov-2006, 13:00 -- 14:00.
- 12 sets of 512x512 images, in Al-poly, C-poly, thin-Be, med-Be, and med-Al.
- Confirmed no night, no SAA, no significant activity (GOES B0 level).
- No significant jitter, was in pretty stable pointing.
- xrt_prep,index,data, iout,dout, /norm,/float
- Separate into each wavelength, and take average of 12 images.
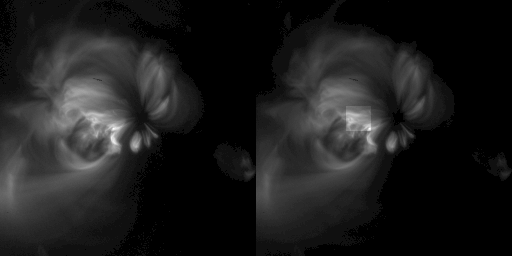
- Pick a region similar to Reale et al (2009).
- Calculate average signal per pix.
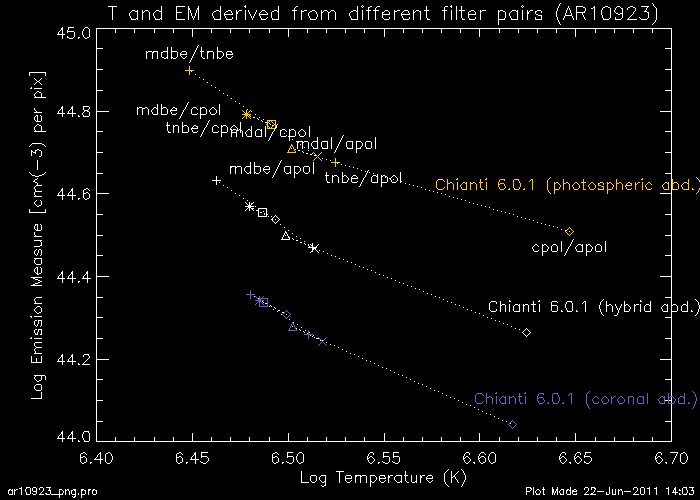
- TEEM analysis (with modified sxt_teem2.pro) using the averaged signals.
- Encountered some difficulties .... med-Al/thin-Be & med-Al/med-Be ratios


