Project Overview:Evaporation Driven By Thermal Conduction
Fast magnetic reconnection releases energy by shortening magnetic flux tubes rapidly, thereby rapidly compressing the plasma they contain. This compression is rapid enough to be super-sonic and thus generates a shock, the most well-known feature of fast magnetic reconnection. Thermal conduction moving ahead of the propagating shock can drive evaporation from the chromosphere and transition region. The efficiency with which the thermal conduction front drives evaporation will depend, to some extent, on the geometry of the flux tube as it crosses the transition region. Strong constriction, as might occur at the center of a network element, will reduce the energy flux, and possibly reduce the evaporation. On the other hand, an expanding nozzle will accelerate supersonic evaporation which is driven though it. We will use a one-dimensional hydrodynamic code to explore the effect of flux tube geometry on evaporative upflows driven by shock-initiated thermal conduction fronts.
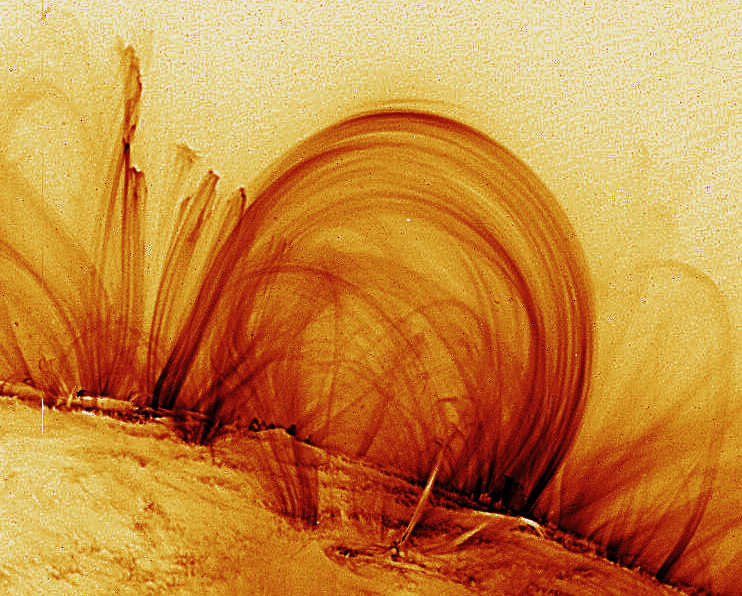
Fast magnetic reconnection releases energy by shortening magnetic flux tubes rapidly, thereby rapidly compressing the plasma they contain. This compression is rapid enough to be super-sonic and thus generates a shock, the most well-known feature of fast magnetic reconnection. Thermal conduction moving ahead of the propagating shock can drive evaporation from the chromosphere and transition region. The efficiency with which the thermal conduction front drives evaporation will depend, to some extent, on the geometry of the flux tube as it crosses the transition region. Strong constriction, as might occur at the center of a network element, will reduce the energy flux, and possibly reduce the evaporation. On the other hand, an expanding nozzle will accelerate supersonic evaporation which is driven though it. We will use a one-dimensional hydrodynamic code to explore the effect of flux tube geometry on evaporative upflows driven by shock-initiated thermal conduction fronts.

|
Having been indroduced to the code and shown how to run it I set about starting some runs of the code myself to get some familiarity with working the codes. First a background run was simulated where our piston created a shock down the tube with no chromosphere and, thus, no transition region (temperature ratio=1) . Another change made to the model was setting kappa (thermal conductivity) to be zero therefore we had no thermal conduction front (as it had no abality to conduct heat) in this initial background run. The piston speed in the run was mach 3 (hot plasmas generally have mach number of 3,4 or 5 but the larger the mach number the longer it takes for the simulation to run). After this simulation was run I found that there was a strange peak and dip in the denisty and temperature profile indicating that there was an error somewhere in the set up of the simulation. After speaking with Sean we concluded that this strange behaviour was because when we set the thermal conductivity to be identically zero there was no connection between the temperature at one end of the tube to the other which was causing this error i.e. the shock was unable to communicate with itself as it ran through the tube. After hitting this first barrier I then altered the value of kappa(the thermal conductivity parameter) to be kappa_0/20, a very small number. The simulation was then run as before with this alteration in place. Making this change got rid of the strange peak and dip in the density and temperature profiles. A shock was created by driving the piston at a speed mach 3 pushing the fluid particles and compressing them into the tube creating this shock with speed mach 4.2360680. A greater speed then the piston speed. As the shock comes from the RHS of the tube we see initially a region where there is a higher density and pressure and the velocity is non-zero. As time evolves the higher density and pressure region seen initially spreads out over the tubedecreasing in strength (see pressure top plot and density middle plot below) as the shock propogated along the tube. Also the velocity where the shock is initially is non-zero, the piston shock initiated fluid moving to the left (hence the negative sign) which is non-zero. If we look at the temperature profile as time evolves the temperature spreads beyond where the subshock ends up after 1000 frames. This is due to the thermal conductivity parameter that was introduced creating a heat front that moved ahead of the propogating shock causing the heat front to move to 3.0 instead of approximately 6.5 as the subshock does. 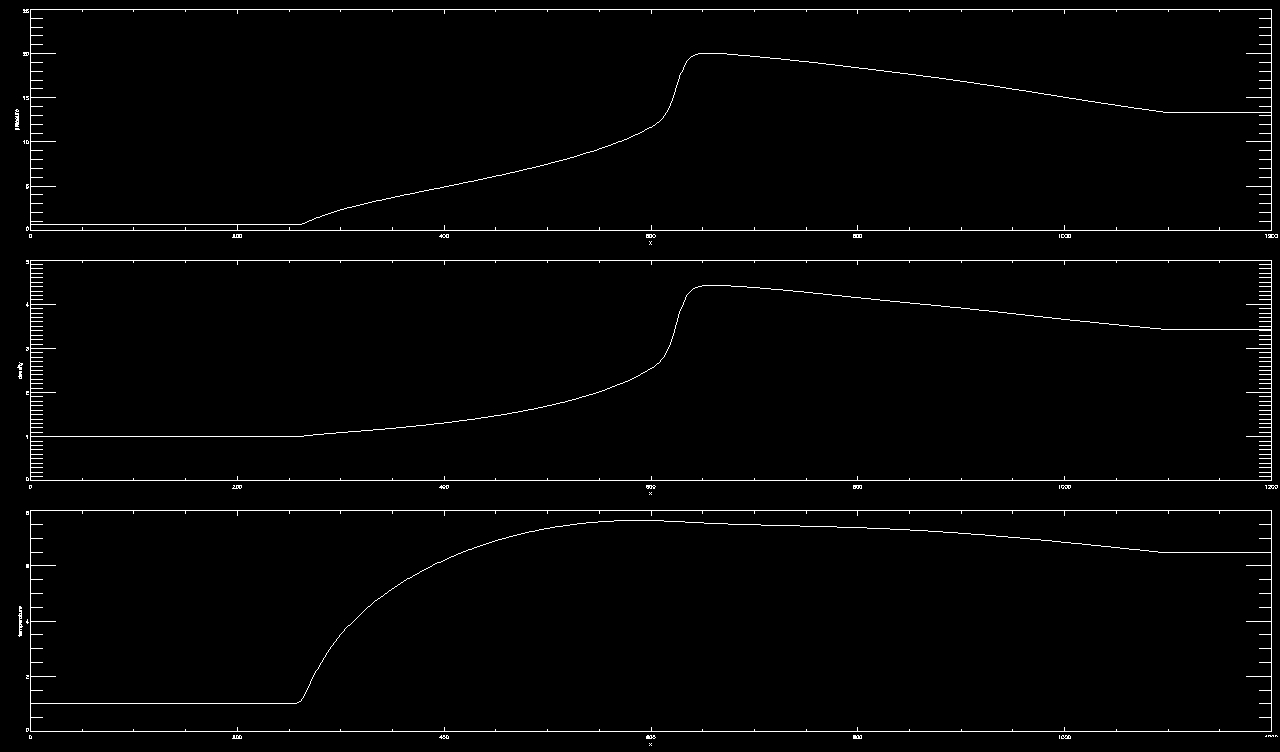 The peak seen in the density and pressure profiles is just the subshock as it moves through the tube. After 1000 frames we see that the shock has moved forward to approximately 0.65 along our tube of unit length. This morning was spent writing up a short piece of coding to calculate the mass,momentum and energy of the fluid inside the tube that is compressed by our piston shock. Basic conservation laws tell us that the mass,momentum and energy of the fluid inside the tube (of unit length) must be conserved. The linear relationship seen between mass and energy with time is due to the shock propogating through the tube (see below plot). Similiar behaviour is exhibited for momentum. There is an increase in momentum with time for the same reason as for mass and energy however as the shock is travelling from right to the left the velocity is negative hence giving us a negative increase in momentum. 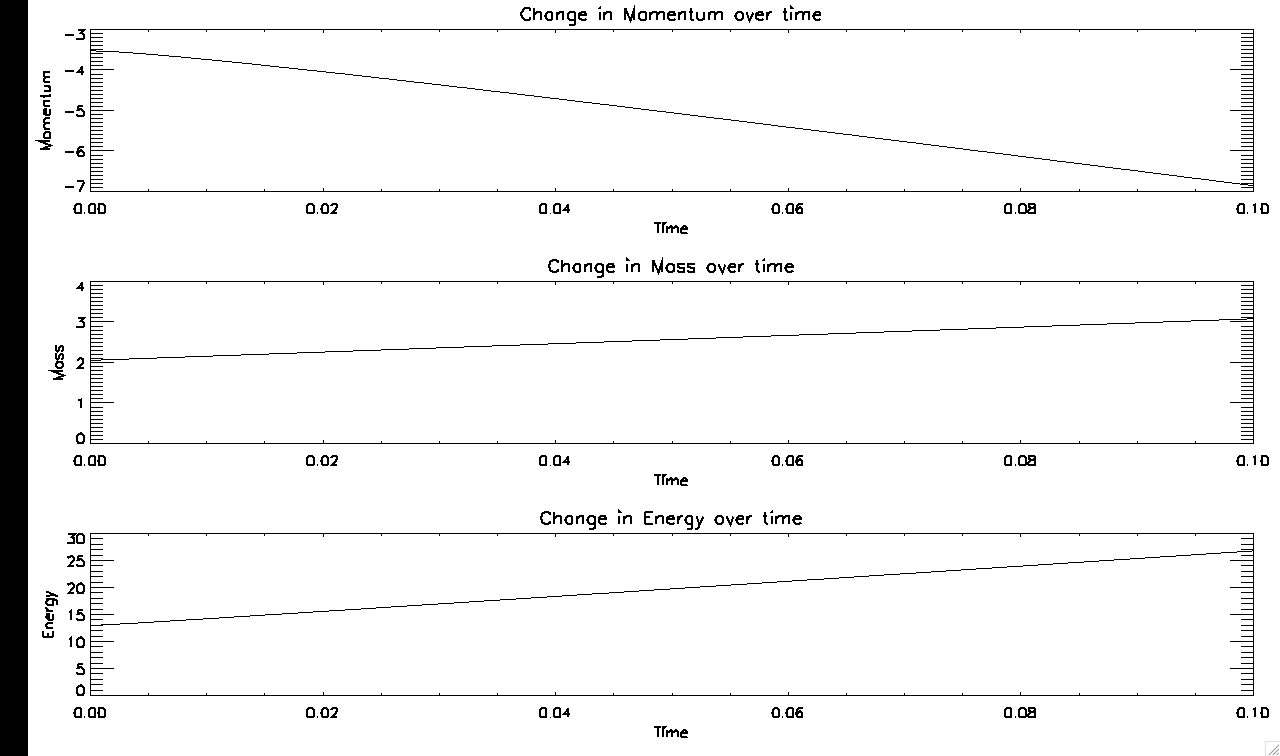 A programe was then written to calculate the gradients of the three above profiles, for this run i found that the gradients of the mass and momentum were very close to the actual values of the mass flux and momentum flux through the right hand boundary! Energy was a little more tricky so we left that... Today I ran a simulation similiar to yesterdays simulation of the shock running through a tube with no chromosphere however this time the area of the tube was altered so that there was a nozzling effect (i.e. a tube of unit length with an area of expansion before contracting again). 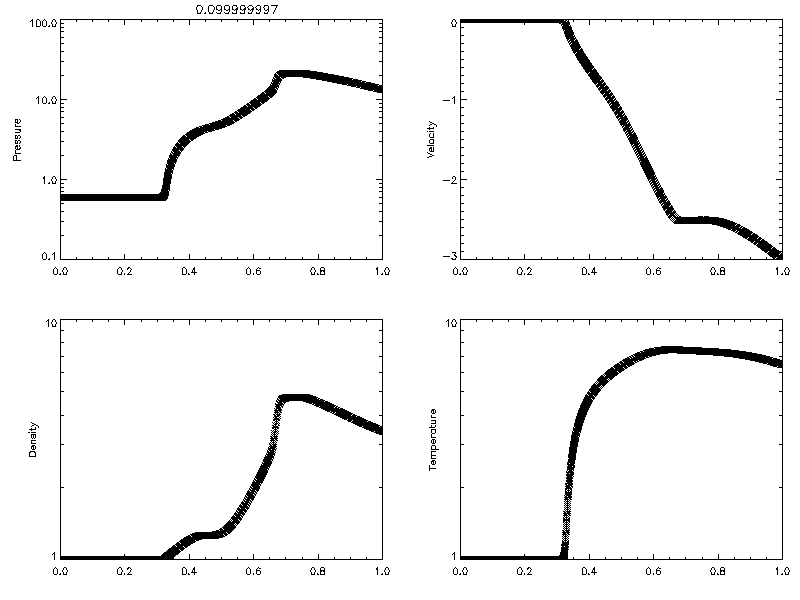 The first thing to make note of is the curvature moving ahead of the subshock in the density plot. This is more curvature than seen in the previous run where the area of the tube was uniform. Also in the pressure, density and velocity plots we can see that the subshock has moved from its initial position of 0.9 to approximately 0.65 along the curve. While if we are to look at the temperature plot over the tube we see that even though we had a very small thermal conductivity parameter (K_0/20) we still see how the thermal conductivity front has moved ahead of the propogating shock significantly. The heat front here as you can see from the diagram has reached a value of 0.3 while the shock as seen from the density, pressure and velocity profiles has only reached a position of 0.65 along the tube. This is important to note as clearly we wont need to propogate our shock into the transition region we only will need to have the heat front move into this region to study the effects of evaporation in the chromosphere. Tomorrow i will go into a more detailed comparison of the two cases studied so far, the tube with an area variation and shock moving through it and the tube without area variation and shock moving through it to see if there are any significant changes before adding in a chromosphere to the runs. So far this week two background runs were studied. We left the tube as a tube of unit length with a temperature ratio of 1 so that we were studying the case where there was no modelled chromosphere. Then we created a shock in both tubes using a piston each time with a mach speed = 3. The difference that we wanted to focus our attention on was the cross-sectional area of the tube. The first case studied was the tube with no cross sectional variation and then the other was with a cross sectional variation. Yesterday the results were shown of a shock run through a tube with a variable cross-sectional area (see above plot). In comparison here is the plot of the run (after 1000 frames) of the shock running through a tube with no variation in the cross sectional area. 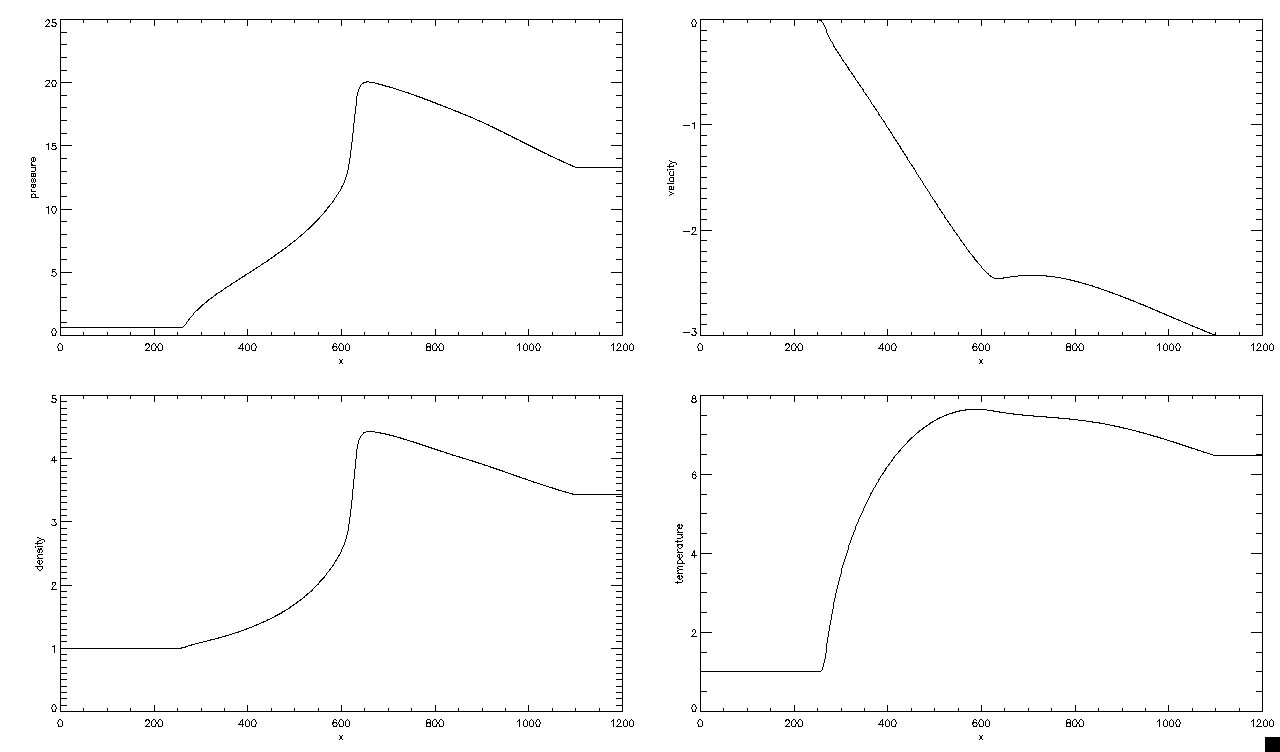 The subshock evidently moves to the same position of 0.65 along the tube after a run (1000 frames) of our model under both conditions. Another link between the two runs is the temperature profile which exhibits the same behaviour as when we had a variation in the cross-sectional area. However the heat front when viewed in a movie form over time moves a lot quicker through the tube to this position when the cross-sectional area is varied rather than uniform. Another key point to make is the notable ridges seen in the pressure and density plots when the cross-sectional area is varied. It appears that due to this constriction made on the tube that the pressure suddenly increases as the fluid is forced through this smaller area and thus the fluid density also increases dramatically causing another seperate shock at this point in the tube. Previously i was unsure of the exact position of the variation in the cross-sectional area of the tube relative to the transition region so today i set about plotting out first area A over the temperature variation over the tube and then the same thing for area C our two non-uniform areas. 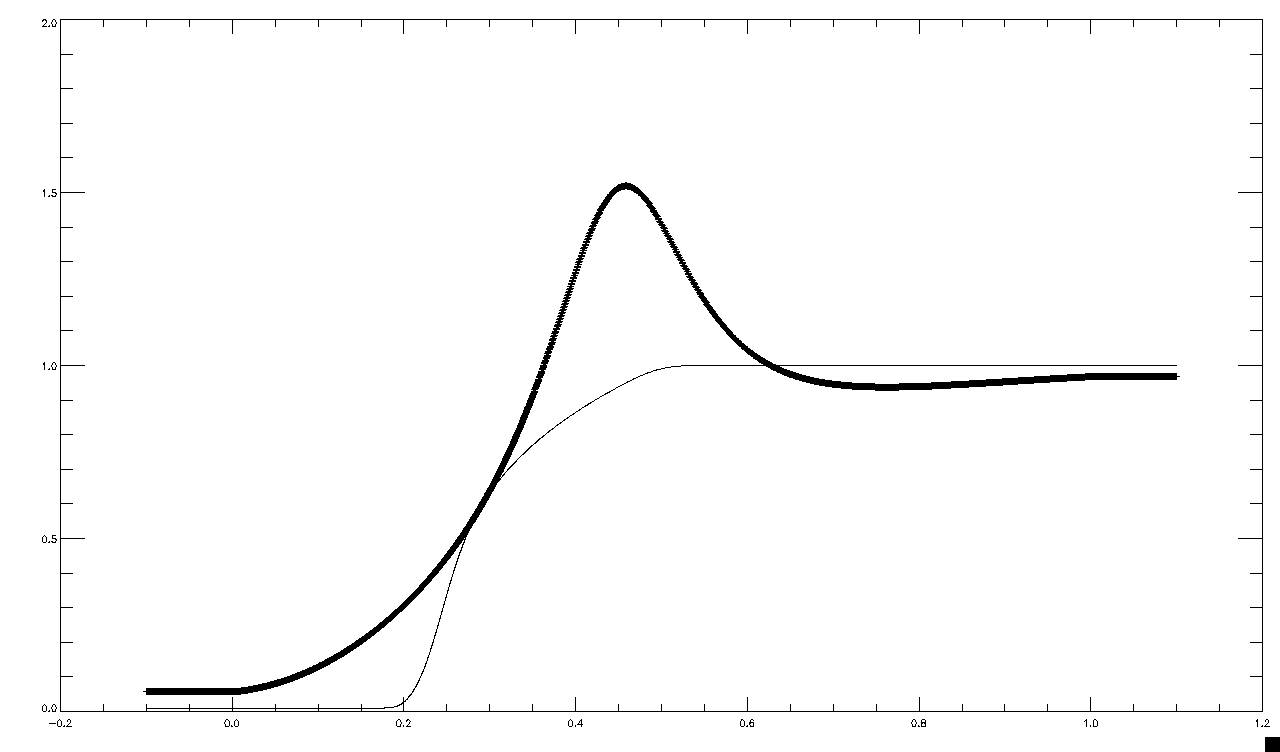 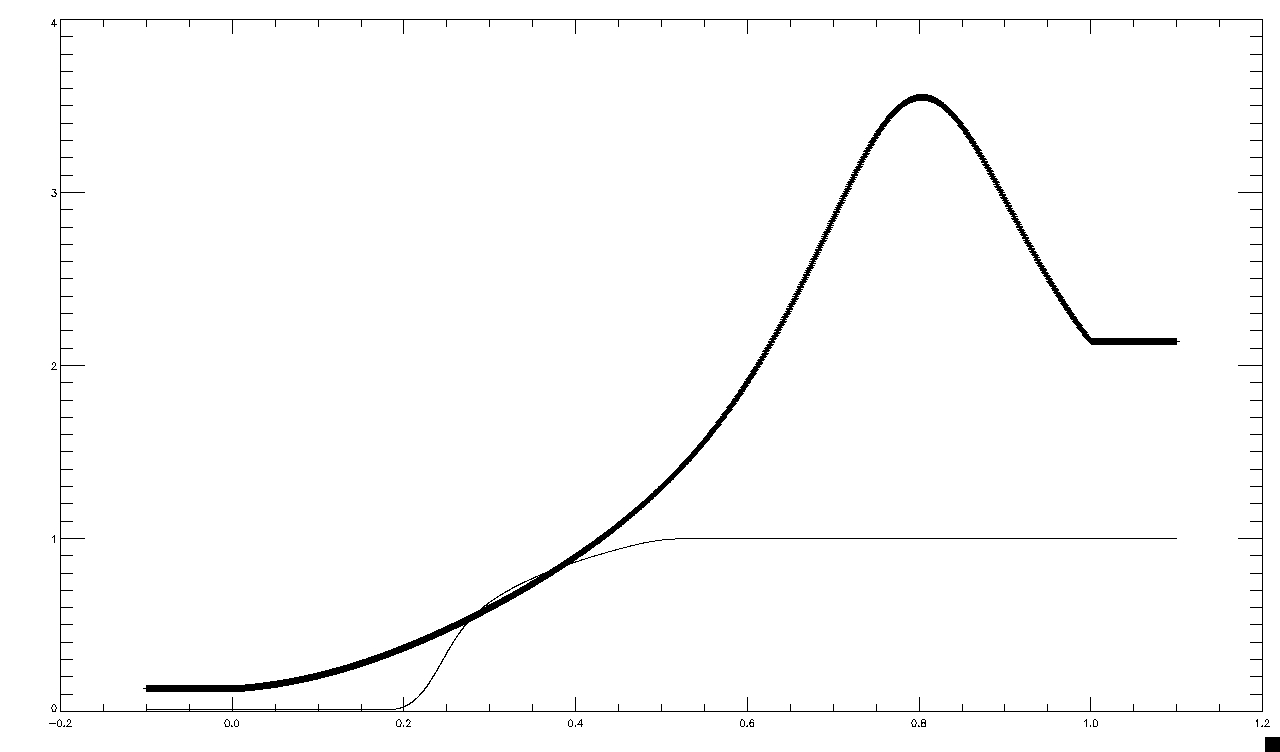 Today I ran a model of the tube with a cross-sectional variation A where the tube starts out of unit height and then slightly contracts before expanding and then suddenly contracting again. I ran three different runs altering the position of the peak in the cross-sectional area relative to the transition region. The model was ran first with a piston driven shock of speed mach no.=3 and the expanded region of the cross-sectional area in the tube placed at a position of 0.7 (the one extreme end, close to the corona) The fluid variables of this run were again plotted and studied: 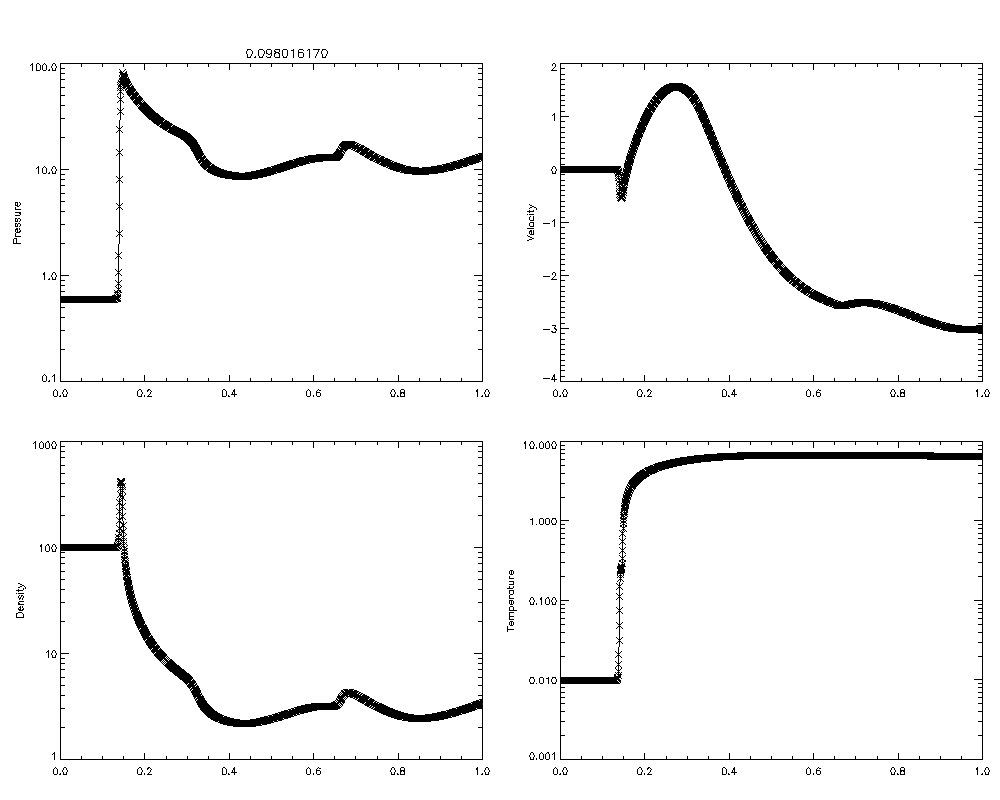 First, focusing on the velocity profile, we see that there is a small dip where the velocity is negative (i.e. fluid is moving downwards), this we think is condensation occuring as we move through the transition region into the denser chromospheric region. A positive velocity peak is seen. This is the evaporation front moving up the tube (to the right in our model) into the coronal loop. When the conduction front reaches the transition region (which it does ahead of the piston shock created) the conduction front created by the steep temperature gradient heats the gas in the chromosphere at the base of the transition region creating a small region of high pressure. A peak of high density is also seen. As chromospheric evaporation occurs the chromosphere (far left hand side of tube) is being compressed by the conduction front. The temperature, density and pressure profiles are all related by the ideal gas law (pressure=density*(boltzman constant/molecular mass of the gas)*temperature). The region over which the temperature is at a constant value (at the top of the peak were the temperature is approximately 6,000K) we see that the density is increasing over this region of the tube. Therefore by the ideal gas law the pressure must increase also over this region which is evidently seen in the pressure profile. Now when the temperature suddenly drops (between 0.15 and 0.25) we see over this region the density is now constant and we see a sudden large drop in the pressure profile. The peak in pressure causes material to be pushed in all directions. As we are only considering a 1D model this pressure peak pushes material off to the left and to the right. The material pushed back along the tube (to the right) is the evaporation front (see small bump on LHS) this fills the coronal loop causing it to slowly collapse as the material within the loop becomes progrossively denser (solar flare seen).The material moving off to the left is due to the conduction front continuing to push this material along the tube compressing the chromosphere (condensation occuring). Another interesting thing to make note of in this simulation is that the shock becomes less visable over time. When we look at the run where the position of the expanded region of the nozzle lies to the left of the transition region, the shock appears to be more visible over this same time frame (see below plots). This could be due to the fact that the shock runs quickly through the expanded region (the shock is travelling at super-sonic speeds and thus speeds up as it goes through the expanded region) but then has to slow down due to the contracting cross-sectional area of the tube which dampens the strength of the shock going through the tube. 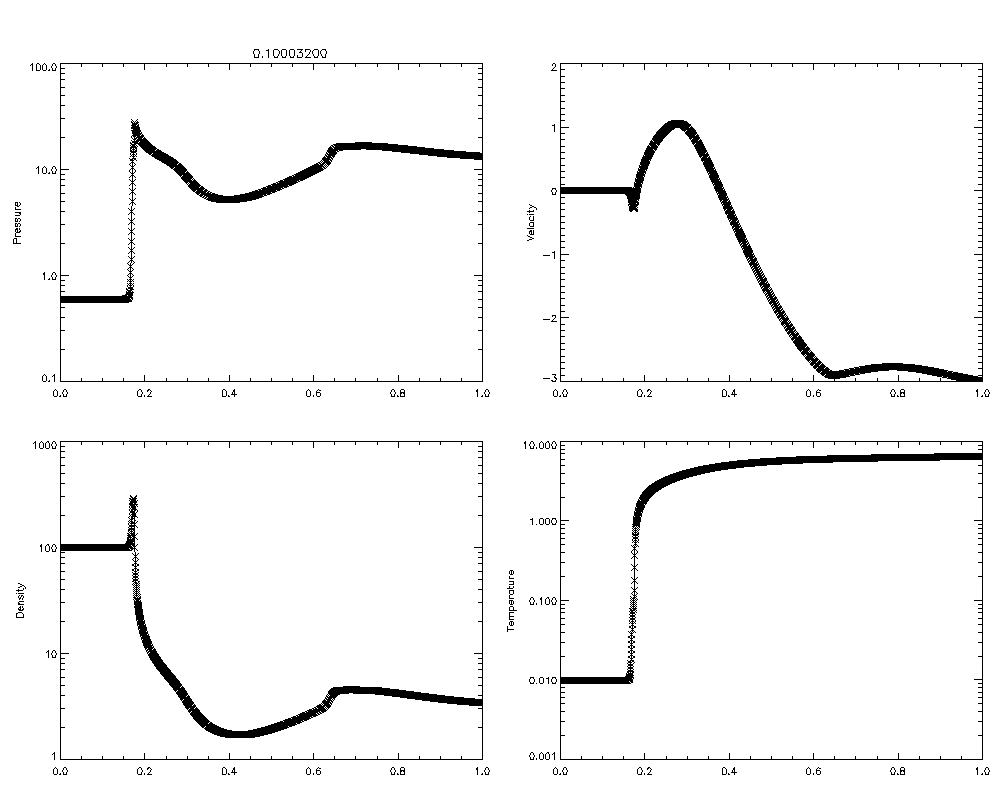 The evaporation front in this run is much less prevelant. The velocity at which the evaporation front is formed and moving along the tube has has been affected by the positioning of the nozzle in the tube. The evaporation of chromospheric gas occurs more rapidly when the expanded region of the nozzle was to the right of the transition region while the velocity of the evaporation front moves much slower when the expanded area of the nozzle lies to the left of the transition region. The heat front moves slower through the tube until it reaches the expanded region where it speeds up but as this lies far too the left the process of evaporation occurs over a long time frame. The case where the transition region lies within this expanded region of our tube (the nozzle) is the last case ran today. The output of this run is shown in the below plot: 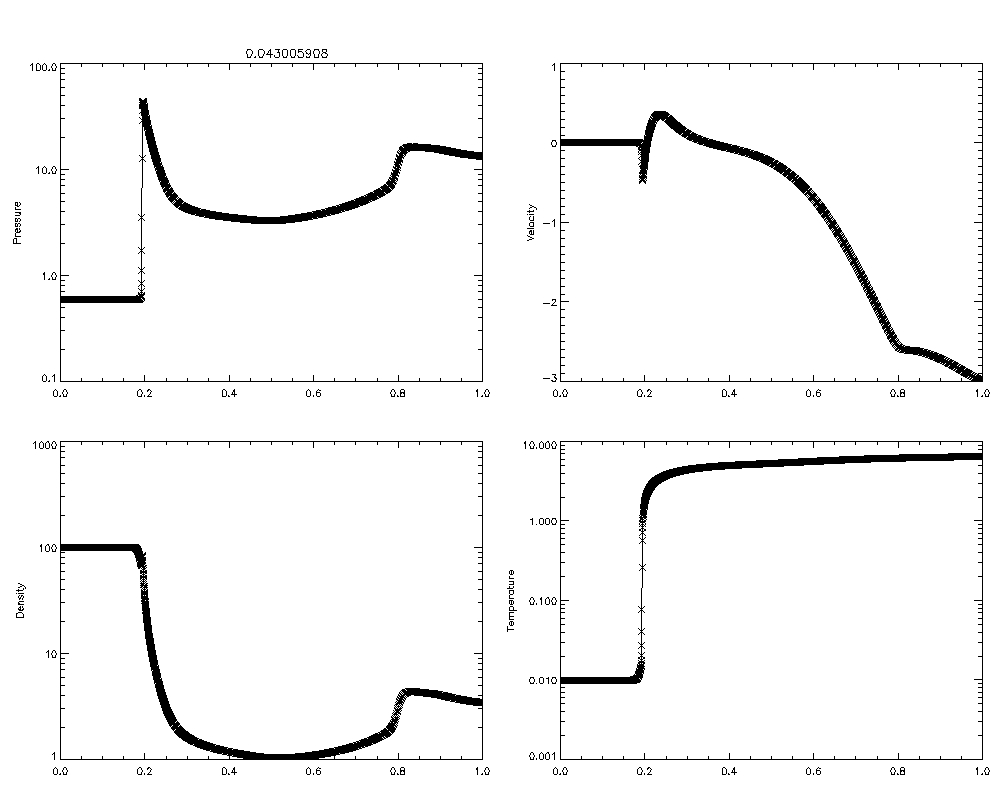 Again we see a peak in the pressure profile as a localized region of high pressure is produced by the conduction front that was transmitted through the temperature gradient heating the gas in the chromosphere at the base of the transition region. However the peak is not as large as before. The evaporation front takes mlonger to form than the previous two cases. The solar flare under these conditions occurs over longer timescales. Also note that here there is no peak in density. This could be due to the fact that the chromosphere is not being as strongly compressed over a localized region. Another observation to make is that the subshock has only moved to a position of0.8 along the tube, while in the previous two runs it moved to a position of 0.65 after the same number of runs. This could be due to the fact that as the area just before the expanded part of the nozzle is small and the shock is not aware of this smaller cross-sectional area and therefore slows down, hence why it has not moved as far down the tube as the previous number of cases. The next thing to do is to run it for more frames, say 3000 and see if we see any significant changes in the evaporation. It is evident that the transition region position relative to the expanded region of the nozzle of the tube has an effect on the velocity at which chromospheric evaporation occurs. Today I set about doing several runs. The first simulation was a piston shock created of mach speed 3 through a uniform tube with a chromosphere in place (in all the runs to realistically try and model the chromosphere the temperature ratio is taken to be 100). 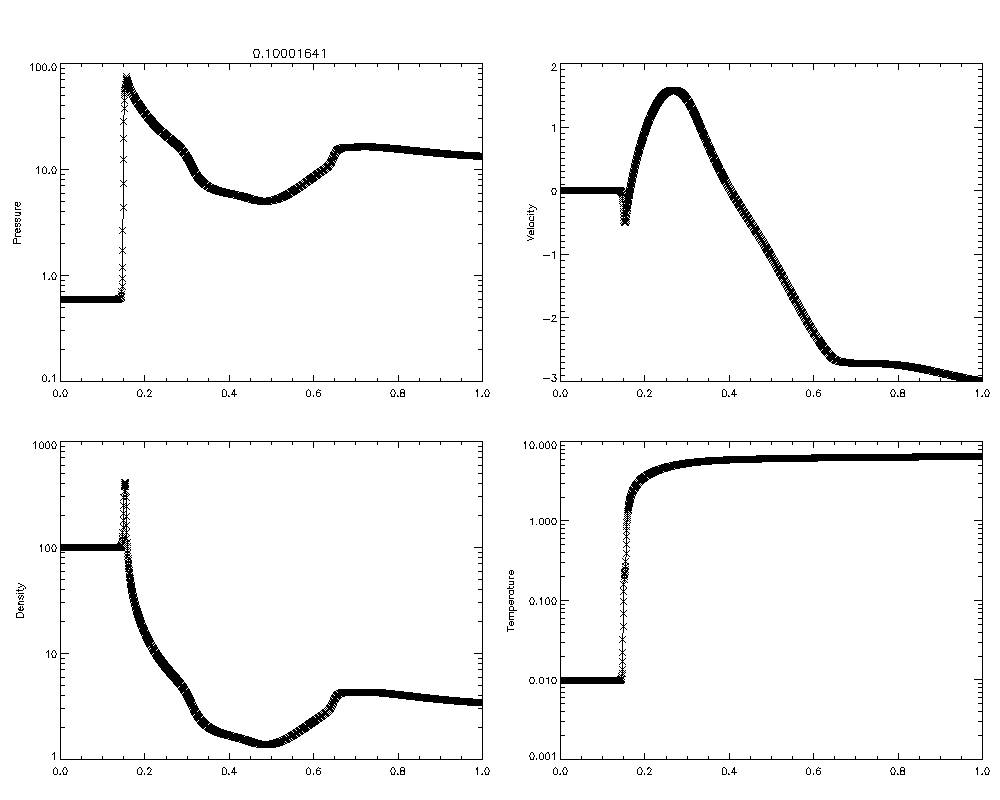 Interestingly if we compare the plots of the fluid variables over space with those of the variational cross-sectional area A seen yesterday where the position of the expansion region was at 0.7 far from the transition region we see these two cases map almost identically to one and other. One thing to note is again the subshock is more visible in this case. As the conduction front reaches the transition region it heats the chromospheric gas at the base of the transition region. This causes a sharp peak in pressure over a localized region. The chromospheric gas is evoporated up into the coronal loop while some gas (a much smaller amount) is pushed down towards the chromosphere (hence the negative velocity trough seen). While this chromospheric evaporation is occuring the chromosphere is being compressed further by the conduction front continuing to move to the left. There is evidently an evaporation front that is formed rapidly and then moves up through the tube into the corona rapidly. Thus the release of energy from the flare occurs rapidly. The next set of runs simulated were those in which the cross-sectional area variation was C. Again three runs were done all with a piston driven shock of mach speed=3 and a full chromosphere in place. Each run differed only by the position of the transition region relative to the expanded area of the nozzle. 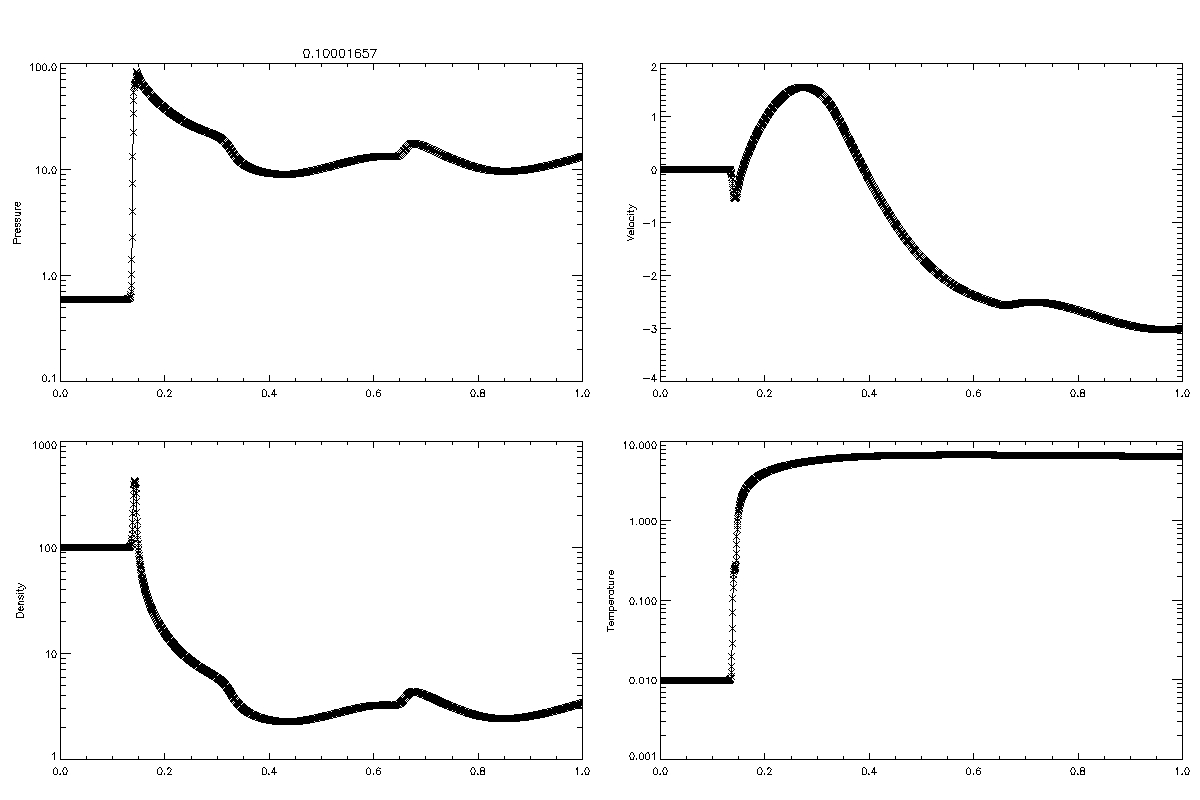 Run of model with expanded area of nozzle lieing to the left of the transition region (expanded part of the nozzle closer to the chromosphere) 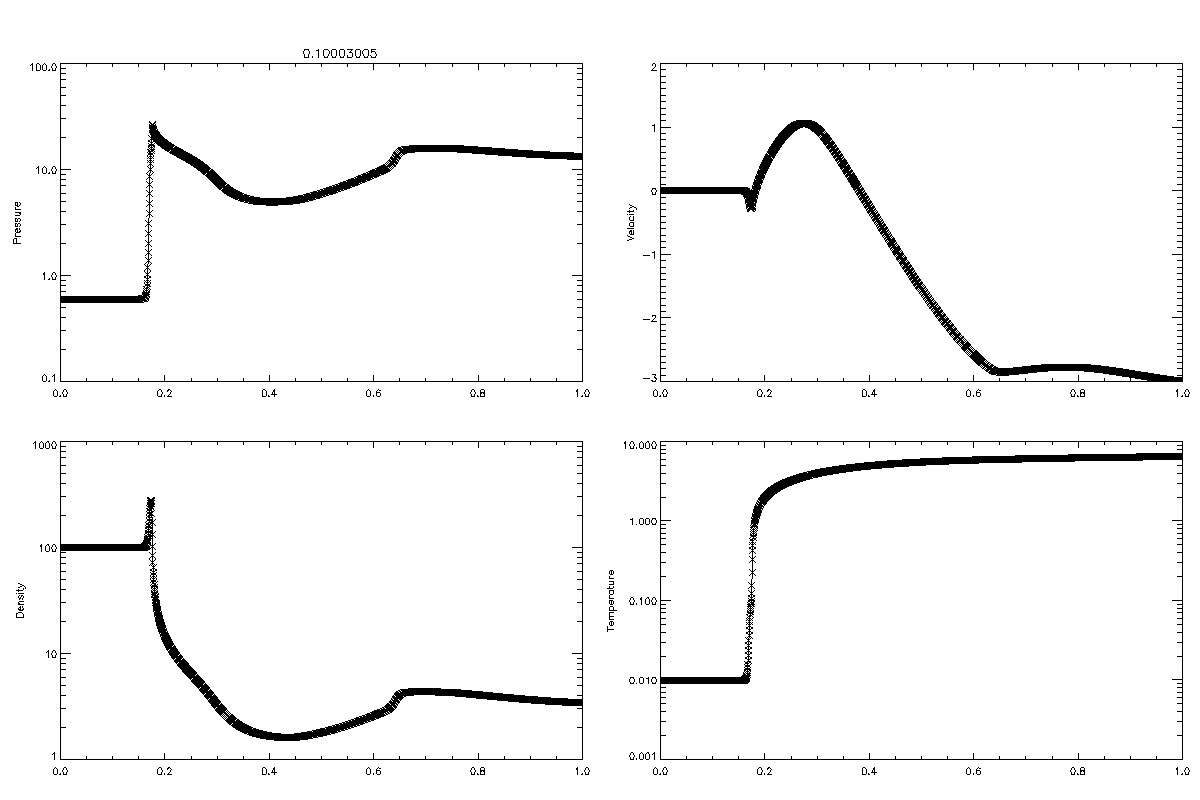 Run of model with transition region lieing within the expanded region of the nozzle: 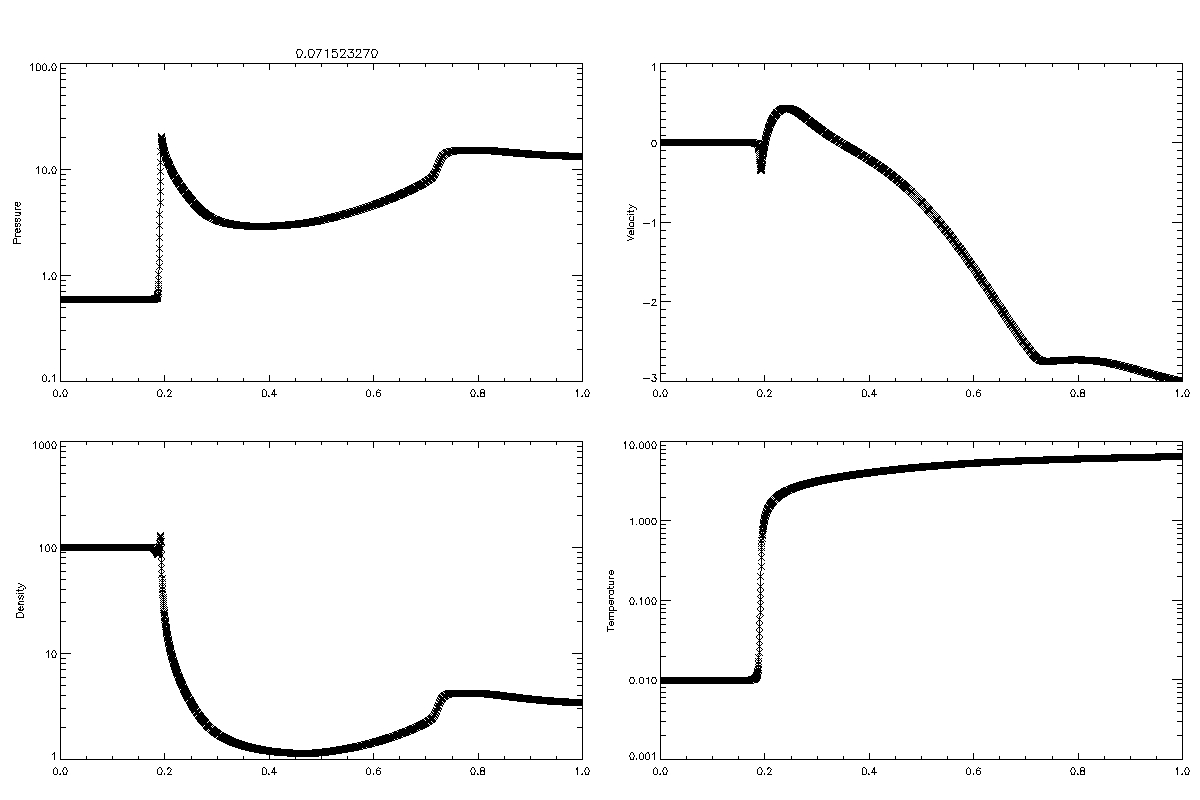 Again in all the above cases we see that the flare energy release (due to magnetic reconnection occuring - the piston shock created to mirror this process in our model) causes effacious heating of material in the chromosphere which produces a peak in pressure (seen in all the above cases) this pressure peak drives chromospheric evaporation adding mass to the corona and also drives hot material into the chromosphere. We are not focusing on magnetic reconnection here, this process triggers solar flares but what we are really interested in is magnetic tension trying to flatten out the field lines and in doing so releasing large amounts of magnetic free energy. In this study we are really interested in chromospheric evaporation. It is believed that chromospheric evaporation is an important process for generating the large emission measures observed in soft X-ray bursts. When the transition region lies in the expansion region of the nozzle (bottom profile set) the behaviour of the above fluid variables is identical to that seen in cross-sectional area A case where the transition region lay in that same position. As before there is no evaporation front apparent after 1000 frames of the model. In the case where the positioning of the transition region is right where the tube is expanding it appears to slow down the evaporation process causing the collapse of the coronal loops over much longer time scales. If the run is continued for a further 1000 frames we eventually see the evaporation front moving back along the tube (i.e. along the coronal loop). Interestingly enough there is a key difference between the cross-sectional variation A and C. In case A we found that placing the transition region to the right of the expanding section of the cross-sectional area caused the evaporation front to move and push material more rapidly into the coronal loop causing a solar flare to occur over a shorter time scale. In comparison, clearly in case C we find that evaporation occurs most rapidly when the transition region lies to the left (closer to the corona) of the expanding region of the tube. Today I am spending the day doing some research on the solar corona and chromospheric flare plasma heating. Heated flare plasma (to create a solar flare) is created when the thermal conduction front moves through the tube and hits the transition region and chromosphere. This produces a large amount of flare plasma. In our model we are focusing on one of the competing processes in chromospheric heating, thermal conduction (note we are not considering nonthermal particles that could also drive this chromospheric heating process). Modelling conduction driven chromospheric evaporation in a solar flare is only useful when we are considering small flares, i.e. C class flares. Magnetic reconnection (which we are simulating in our model by our shock) at the apex of our loop heats up the local plasma. This temperature gradient created by this process creates a pressure peak causing a movement of material (upflows and downflows) through the tube and compresses the expanded heated plasma and causes chromospheric evaporation and condensation (downflow). In our models run before we found that the thermal condcution front that moves through the tube transporting energy causes an increase in temperature (sharp temperature gradient) and pressure gradient in the chromospheric plasma thus driving evaporation in the chromosphere. In solar physics when magnetic reconnection occurs the energy released by this process is moved into the chrompshere in the form of a heat conduction front. This heat front heats up the material in the chromosphere to solar flare and coronal temperatures. This temperature gradient causes a pressure gradient that drives this heated chromospheric material to expand up into the coronal flare loop emitting soft x-ray emission. In our model we are ignoring all radiative affects. It is a good approximation as heat is disspitated by radiative loss in the chromosphere over long time scales in comparison to the short time scales at which the heat front moves through the tube heating up the chromospheric plasma causing mass motions due to the pressure gradient produced by the heat front (which has produced a temperature gradient). The majority of flare energy comes from the fact that the magnetic field lines are getting shorter due to the magnetic tension force trying to flatten them out. This kinetic energy moves the plasma forming a hydrodynamic shock. Magnetic field lines contract due to magnetic tension e.g. like a rubber band. There are two competing factors that can act to heat up chromospheric material: non-thermal particles and thermal conduction fronts. The larger flares (M and X class flares show evidence of non-thermal particles while for C-class flares no non-thermal particles are seen in observations thus we focus in our model on thermal conduction model. (classical Spitzer-Harm model) We believe that chromospheric evaporation is an important process for generating the large emission measure observed in soft X-ray bursts. Flare energy applied (in the form of a shock) and the transition region is pushed slowly downward by an advancing thermal conduction front that moves ahead of the progpoagting shock. Tight gridding over this region is required to accomodate this movement. Evaporation is what leads to loop filling and thts why brightenings in 1600 Angstroms for example. (note: 10 Angstroms = 1 Nano metre) We noticed that something was not quite right with the results seen previously, even though we tried to make sense of the outcomes. What was strange about the above cross-sectional area variations was that in the altered case C the tube appeared to be cutting off before going down to 1 (what we were modelling our corona to be) on the right hand side of the graph (see above image of cross-sectional area C). The area function was then altered to be of the form: A(x)= C1 + C2tanh^2(C3(x-X1)) + C4/(1 + ((x-X2)/C5)^2 where C1,C2,C3,C4,C5,X1,X2 are all constants used to alter the variation of the cross-sectional area of the tube for the three cases A(larger curve),B(uniform tube) and C(tighter curve). Now having made these changes to the code we are going to simulate a set of new runs. In this set of runs we are not altering the position of the transition relative to expanded region of the cross-sectional area variation just keeping it as it is. Another difference to these set of runs is that we are going to run the model until our conduction front reaches the left hand wall (our modelled chromosphere). We are running it at 6e^-4 seconds per frame instead of previously 1e^-4 and running 3000 frames to ensure that are conduction front reaches the chromosphere. You realise how research can take many turns and that you sometimes have to back track before you actually get on the correct path! This week i spent running three runs where the transition region was in a fixed position relative to the expanded region of the cross-sectional area. Three cases were considered, cross-sectional variation A,B and C. Cross-sectional variation B was a uniform tube which we later discovered we wanted to have constricted in at the end...this is for the next runs so for now this tube was kept uniform. 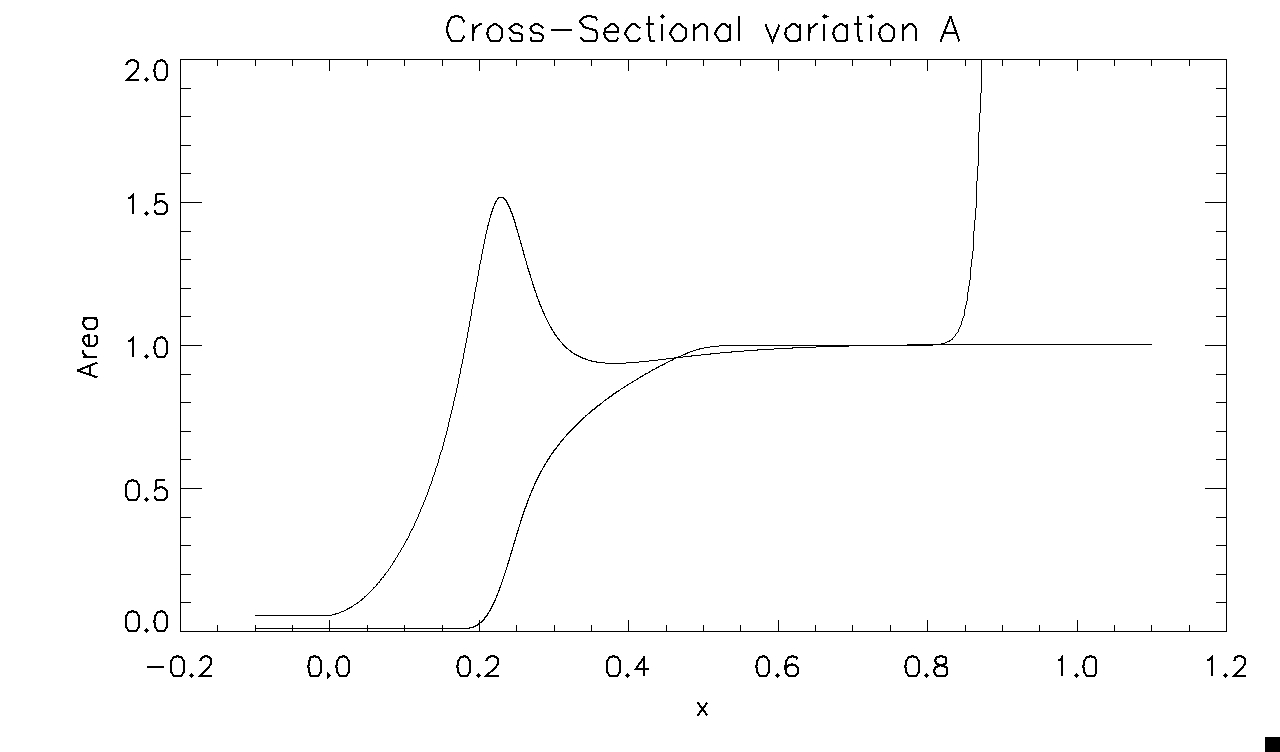 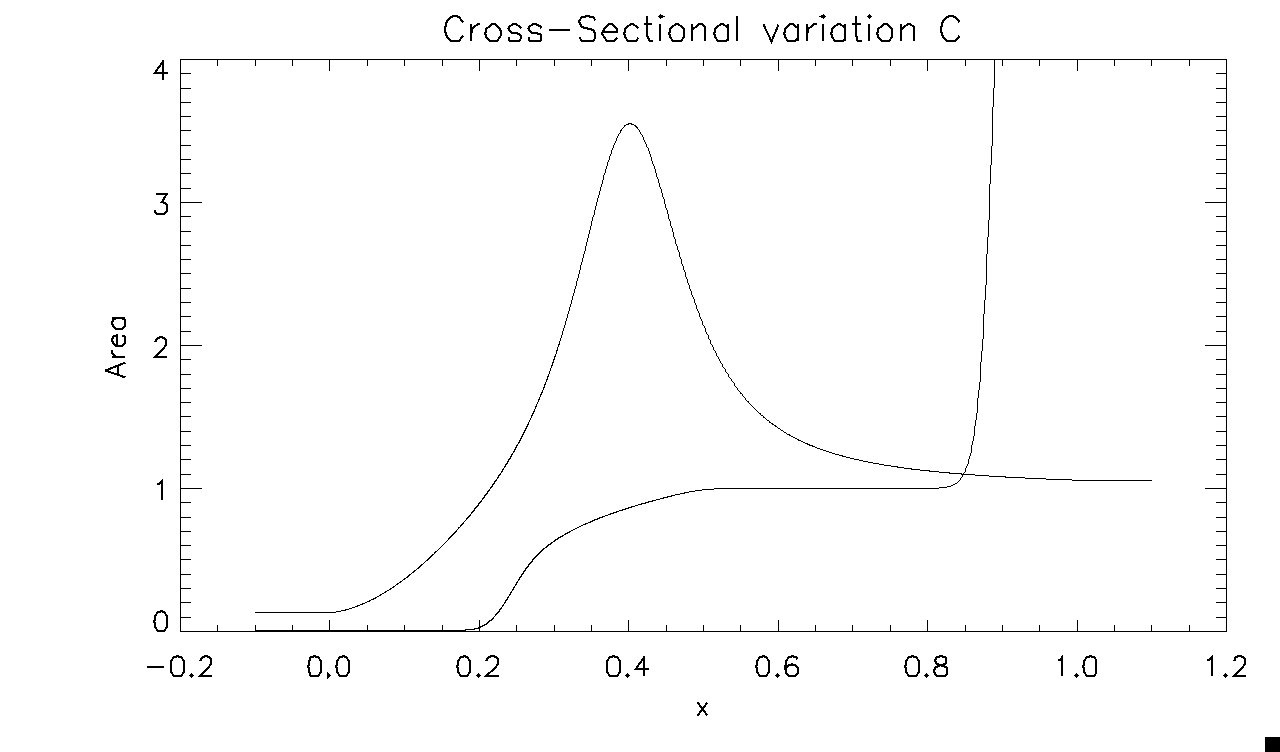 Comparing the runs for the two loops with variable cross-sectional areas with the uniform tube (our original model) Movie of thermal conduction front running through a uniform tube driving chromospheric evaporation: Uniform Tube Here we see before the movie even begins to run the shock in the temperature profile. The pressure is higher where this shock is and constant in the chromosphere and transition region. The velocity is zero in the transtion region and chromosphere and non-zero for our shock. Another thing to make note of is our artificial set up of the chromosphere by creating this temperature profile, hence we get a curve in the temperature where the chromosphere is by having added in a heat source and sink ( source in the coronal region and sink in the chromosphere region ) this gives us this temperature gradient. The temperature is inversely related to the density hence why we get a curve where our transition region lies in the density profile. Our chromosphere is cool and dense allowing us to have a stable atmosphere. When the run is begun we see the evaporation front moving up through the tube we also see the downflowing (condensation front) moving through the tube which compresses the chromosphere resulting in this chromospheric shock seen after the run is completed. The run takes approximately 105 seconds to complete (by complete we mean when our thermal conduction front reaches the left hand boundary). There is a relatively wide region of evaporation and a thing region of condensation. The evaporation grows as long as it is being driven by the pressure peak. At about 90-100s into the run the upflow of material has almost seized, it appears that the propogating shock is cancelling out our upflowing material. The chromospheric shock is seen at approximately 50s (most evident in the temperature profile). If we look at the equation of motion we see that density*(change in u)/(change in t)=...-(change in pressure)/(change in the length). Therefore flow is going to be fastest where the pressure gradient is steepest i.e. where the legnth is small over which the pressure is changing. A movie of hydrodynamic shock running through loop A: Loop A The set up is the same as before. There are several interesting differences that can be noted in comparison with the uniform tube. Firstly we see a double peak form in the pressure and incidentally the velocity profile. This we believe is due to partial reflection due to a build up in pressure where the material is trying to squeeze through the constricted region of the tube. This behaviour is probably due to the positioning of our transition region which lies in the solar flare expansion region. If we look at the diagram of cross-sectional variation A we see that the area contracts just before it expands and then contracts again rapidly - this appears to be the cause of pressure build up and hence the result of this double pressure peak. Another thing to make note of is the chromospheric shock that is formed. While chromospheric evaporation is occuring the chromosphere at the base of the transition region is compressed by the downward moving thermal conduction fronts and we get this peak in the density profile seen due to this compression. This results in this chromospheric shock. We see this in the temperature profile as a little ridge and also in the pressure profile ( a small ridge of high pressure ). This chromospheric shock is seen in all three cases but is most evident in loops A and C. There is a larger density peak in tubes A and C and therefore maybe the strength of our chromospheric shock is greater in these two cases than in the uniform case. The downflow region (condensation material) is even thinner than for loop B initially. However this downflowing material by the end has thickened up. We would think that as the upflow is centred around the transition region in tube A we would expect the shock to move through the expanded region even more rapidly (as it is travelling at a supersonic speed and hence will speed up through the expanded region of the nozzle). Expect that the shock would interfere the upflowing material more here than in the uniform case but this isn't what we see. It could possibly be that the upflowing material is cancelled out by the shock but the pressure peak seen due to this reflection due to the constriction of the tube, is driving new material to move up the tube and fill the tube. The shock gets to the widest region of the nozzle and then reflects off the constricted region - pressure reflecting off of this. -Want to look at fourier waves and calculate the reflection and expansion coefficients to see if this behaviour that we are seeing via are model holds. This run took 98s to complete, shorter than the uniform case. A movie of thermal conduction front moving through loop C: Loop C Here interestingly there is no double peak seen in the velocity profile. No reflection appears to be occuring here. This could be because our transition region lies below the expansion region so we dont have this build up in pressure. Here our cross-sectional area expands, it doesn't contract before expanding as in the case of loop A. Following this expansion the loop contracts but much more slowly than in case A. The expansion region is spread over an overall larger region than in case A. This lack of reflection could be due to the positioning of our transition region in the tube or just due to the fact that the area variation of the tube is very different to that in case A. We think that if we position our transition region directly where the expanded region is maximum in the loop that we will again see this reflective behaviour exhibited for the case of loop A. Here we have again and extremely thin downflow region initially. Need to zoom into this region in order to see if this is any thinner than in case A. It is thinner initially than in the uniform case. Again there is this second pressure peak seen, not as large as in case A but the shock comes intowards and then reflects off. See to see reflection in each case occuring at dA/dl=0: where the tube expansion is at its maximum. The velocity of evaporation front moving up through the tube is greater than the velocity of this front in the uniform loop and loop A. Why is this the case? Two different explanations that we have come up with to explain this behaviour: (1) the larger expansion region (2) the position of the transition region relative to the expanded region of the loop. Here the transition region lies below the expanded region. What we are going to focus our interest on next in the following weeks is this postioning of the transition region and what effect this has on the evaporation front.
Evidently the time taken for the pressure peak to be formed for loop C takes longer to form than for loop A and the uniform loop. However after this pressure peak is formed, in loop C, the condensation front moves very rapidly through the tube and thus the evaporation front forms very rapidly. For the uniform loop and loop A the time between the pressure peak being formed and the evaporation front beginning to move up the tube is much greater. For loop A this is the longest. The big question is why this is occuring? Notes to make about the model. As we are looking at the active regions on the corona (solar flares) in our model we wanted to make sure that the coronal density (everything is scaled in our model to coronal values) and temperature are accurate for active regions of the corona. In active regions of the corona the average density is 10^9-10^10 particles per cm^3 and the temperature ranges from 2MK to 4MK. In our model we have taken the coronal density to be 10^9 particles per cm^3 and the coronal temperature to be 2MK, the lower end of the spectrum for active regions but it seems like a realistic model as we are modelling C-class flares, the smaller flares. Today i set about running a new set of runs with a new gridding so that the gridding is tighter around the transition region and into the chromosphere. Another thing that we altered was the value of k0. Originally as we were taking k0 to be 0.17 a small value the length of our tube (which depended upon this value) was large, 60Mm for half of the loop giving us a loop of 120Mm which is possible but more likely for M and X-class flares. Therefore we decided to alter the k0 value and make it larger therefore giving us a half tube length of 15Mm which is much more realistic for a C-class flare. We made our K0 value approximately 4 times larger so it is now 0.7. The thermal conduction front will move more slowly through the tube due to this alteration. This alteration will give us a more realistic model for modelling these C-class flares.
These tables of results are from previous runs done with the non-altered k0 value (k0=0.17) here and also we took the coronal temperature to be 1MK in all of these cases. These runs also are not using the new re-gridding mention previously. As predicted a double peak, not as apparent as in case A, is seen in the velocity profile where we have altered the position of expansion so our transition region lay where dA/dx=0. Clearly the positioning of the transition region in this maximum expansion of the tube causes a pressure reflection to occur. I believe that it is less evident than in case A because in case C the way the area has been choosen it contracts less rapidly and also its region of expansion is much larger therefore the pressure reflection due to the constriction of the tube will not be as strong. Another interesting point to make about these results is that when our transition region lies above where the maximum expansion of the loop is we get very persistant upflowing material, the upflowing material gets faster as the run continues and never slows down. The pressure peak driving the upflowing material increases throughout the run, this must be caused by the placement of the transition region above the expanded region in our nozzle. Maximum flow velocity is also very large here. Heated chromospheric material is filling up the coronal loop rapidly. In contrast to this when we position are transition region so that it lies below the expanded region of the nozzle then our upflow material slows down and begins to dampen out by the presence of viscocity and the weakening of the pressure peak as it moves into the chromospheric region. Pressure peak is being cancelled out by the shock moving through it. For the case when we move the positioning of the transition region even further below the transition region we again see this similiar sort of behaviour where the amount and speed of evaporation begins to decrease as the run comes to completion. Note as the pressure peak moves into chromospheric region we no longer get this support/drive for our upflowing (chromospheric evaporation) material and therefore viscocity begins to dominate and dampens the upflowing material and causes it to slow down. The minimum inversion temperature is what relates the evaporation front to the condensation front. Three further runs were completed for the uniform tube and the varying loops A and C. We altered the thermal conductivity value, we increased the value of k0 to k0=0.7 so that the length of our coronal loop was much smaller (half length of our loop is approximately 15 Mm which is much more realistic in modelling a C-class flare than the 60Mm which we had beforehand). Another alteration to the previous runs completed is the new gridding used in these runs as well as the alteration in the coronal temperature to 2MK - a realistic temperature of active regions of the corona. It appears that the varied cross-sectional area suppresses the temperature at which evaporation first occurs. The varied cross-sectional area of the loop modifies the evaporation therefore it may be possible to get away with a lower mach no. to obtain results that link/fit the observations - previously mach no. = 6.0 was required to fit the observations but we calculated that the maximum mach no. that we could use and have a realistic model would be 4.0. Loop U (uniform cross-sectional area) Loop A Loop C In these three runs what we can automatically see is the lack of formation of the chromospheric shock that was seen in the previous runs. This is due to the increase in k0 which has caused the thermal conduction front to move more rapidly through the loop therefore it doesn't have enough time to form a chromospheric shock. We want to see if we do a run with a very low mach no. if the thermal conduction front moves slow enough that we again see this chromospheric shock forming. This is one disadvantage of using this increase k0 value, we have lost some of the interesting dynamics. Evidently in all three of the above runs reflection and transmission is seen over the region where there is the large temperature gradient (the transition region). However only in loop A due we get this pressure wave reflection. This is believed to be a result of the positioning of the transition region in the expanded region of the nozzle, directly where dA/dl=0. We are going to work on calculating the reflection and transmission coefficients and we want to see if we can show that the reflection coefficient is largest where dA/dx=0. Then this would be evidence, theoretical proof that the transition region placed in this position is the cause of this pressure wave reflection that we are seeing. Do this using linear theory and small wave perturbations about the fluid equations around equilibrium!
There appears to be a correlation between the uniform tube and tube A about the times at which the pressure peak is formed and the time at which material begins to upflow and fill the coronal loop. Loop C doesn't share this same connection with any of the loops. It appears that this could be due to the positioning of our transition region right where dA/dx=0 in case A. As we have increased the value of k0 this has increased the speed at which the thermal conduction front moves through the loop. The thermal conduction front in all of the runs moves much more rapidly through the tube and reaches the left hand boundary and then the run has completed. Although this process has been sped up and we see chromospheric evaporation forming although its only just beginnning to be seen. We can see it evidently in the DEM movies of the runs. In loop C, the upflowing material is very persistant and the speed of this upflowing material and amount doesn't decrease as the run comes to completion while in the case of loop A and the uniform loop the upflowing material begins to decrease as the run comes to an end. In case A we still get relatively persistant upflowing material but for the uniform case this gets knocked out by the propogating shock moving down the tube and the the effect of viscocity slowing down the upflowing material. Today again looking at the results from the runs of our tubes A, C and U. First focusing our attention to the movie of the tube with cross-sectional area variation A. A double peak is formed in the pressure and subsequently the velocity profile. The second peak in the pressure profile (peak to the right) is the evaporating material moving up the tube and filling up the coronal loop. We see a disconnect between the evaporation front moving up the tube and the pressure peak seen moving down into the chromosphere. The peak closer to the left begins to grow close to the end of the run while we see the second peak (the original peak formed by the pressure peak formed) begins to decrease. There is no upflow in the region where the pressure peak has moved to so then it starts driving new material up the loop hence the following growing upflowing material. The evaporationt front is enhancing the density. There is a clear connection between the density profile and velocity profile. We see a slight reduction in the velocity of upflowing material. This reduction in the speed of the upflowing material leads to a slight peak in the density profile. While where we have faster upflowing material we see the density dips down, this is seen in the DEM where the amount of emitting material is reduced there. The material over this small region is compressed together as the material slows down in this area so more stuff gathers together and then spreads out again and the density decreases again. Spread out, then compressed then spread out again (e.g. like in a traffic jam where there is an accident cars are spread out then have to slow down and bunch up together and then spread out again). The shape of the velocity profile is pressure induced. In all three runs, even the uniform case we see pressure wave reflection occuring (right hand side of the pressure peak), however the subsequent behaviour differs in each case. In the uniform case we see this reflection occuring and the evaporation front moving up the tube however there is no second pressure peak and thus no dip and rise seen in the density profile just a small bump where we see the evaporation front moving up the tube and the shock moving down the tube. As the run comes to a finish we see the upflowing material beginning to decrease as a result of the pressure slowly smoothing out, the evaporating material appears like it will be knocked out by the shock that is propogating down the tube plus the viscous forces that are in play and dominating now that there is not the large pressure peak driving the upflowing material. The position of reflection in every case occurs where the transition region was initially. The transition region is where there is the greatest temperature gradient (largest temperature change) this large temperature gradient subsequently changes the sound speed thus causing this pressure wave reflection that we are seeing. Now what we are interested in is what happens subsequntly. Clearly each run differs in the way the fluid variables map out over time. The only thing that is altered in the three runs is the area. The area must be altering the behaviour of the fluid variables but why for case A do we get this double peak in the pressure while in case C we do not see this same double peaking behaviour? Note: as the material in the chromosphere is heated by the thermal conduction front. This chromospheric evaporation fills up coronal loops (or sometimes referred to flare loops - these loops are important in studying the transfer of energy from the corona to the chromosphere and vice-versa. This process emits a large emission measure and thus resulting in brighter upflows thats why we see this bright loops formed post solar flare. Also chromospheric evaporation is the primary coronal heating process - this is why we are so interested in this process. Note: As the heated chromospheric material expands and fills coronal loops it emits soft X-ray emission. We want to look at the emission measure outputted by this heated chromospheric material filling the coronal loop. In order to do this we look at the DEM vs temperature (K), focusing our attention on the CIV line 1600 Angstrom line as this is where the transition region lies, what we are most interested in. DEM movies for the above three runs: Loop U (uniform cross-sectional area) Loop A Loop C The trough seen to the right near to the shock (right high emission very high temperature line) as the movie evolves is the evaporation front while the bump is the condensation front that is formed. In loop A we see a large chromospheric shock being formed which increases in temperature and the emission from this shock increases as the run comes to completion. Still see upflowing material. Another interesting thing to make note of is how the shock that drived our conduction front through the tube has been significantly diminished by the evaporating material moving up to fill the coronal loop. However there is still evidence of the shock there by the end of the run. Clearly the upflowing material is very strong and dense and hot (heated to coronal/flare temperatures). In loop C again we see the formation of this chromospheric shock, however its emission measure is less (dem of 10^31 cm^-5), than in case A. This i believe must be something to do with the area variation as all other variables are identical for the runs. Similiar to loop C the uniform case the chromospheric shock formed here has a lower emission measure than in case A, (dem of just under so slightly less than case C of 10^31 cm-^5). Another thing to make note of is the temperature of the shock is less for this the uniform case (just below 1MK) while for case C it lay just above 1MK as it does for case A. The emission measure resulting from the chromospheric shock is significantly larger for case A (dem of over 10^32 cm^-5). The original shock appears to fight through most in the case C, while it is almost completely diminished for case A and the uniform case. Today was spent analysing and trying to understand the runs where we altered the transition region relative to the position of dA/dx=0 (maximum expansion):
To give us some insight into the positioning of our transition region relative to the expanded region of the loop here are three images showing the differing positions: Note that we are shifting the area profiles and keeping the transition region at a fixed position in the tube in all the shifted cases. 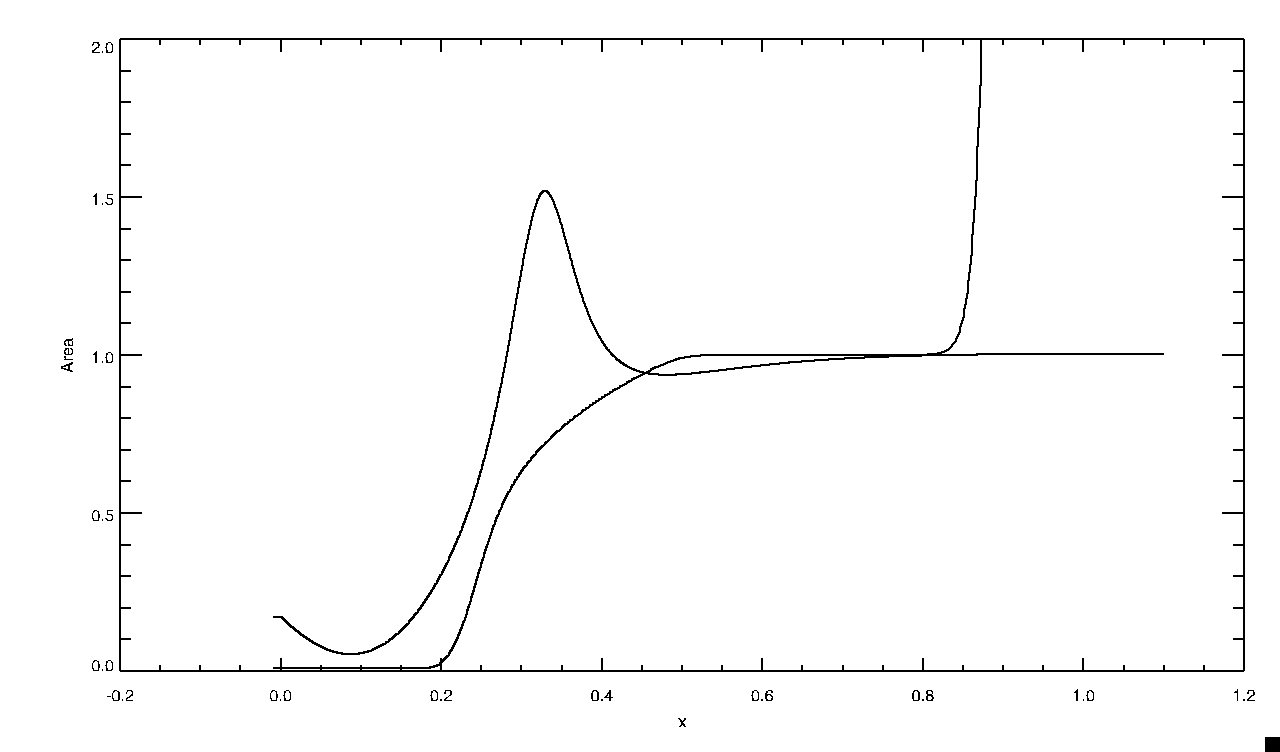 Transition region here is lieing to the left of where dA/dx=0 (area expansion is maximum). Loop A as originally positioned 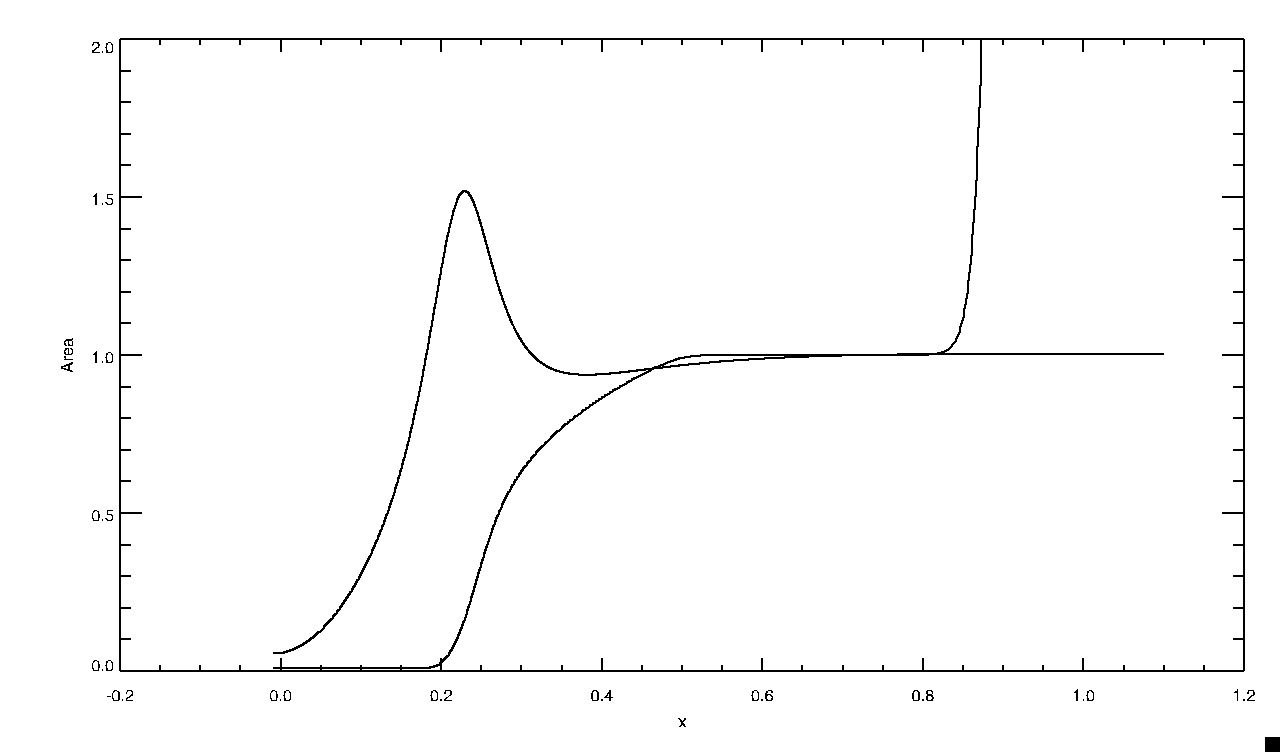 Transition region falls directly where dA/dx=0. Loop A shifted to the left by 0.1 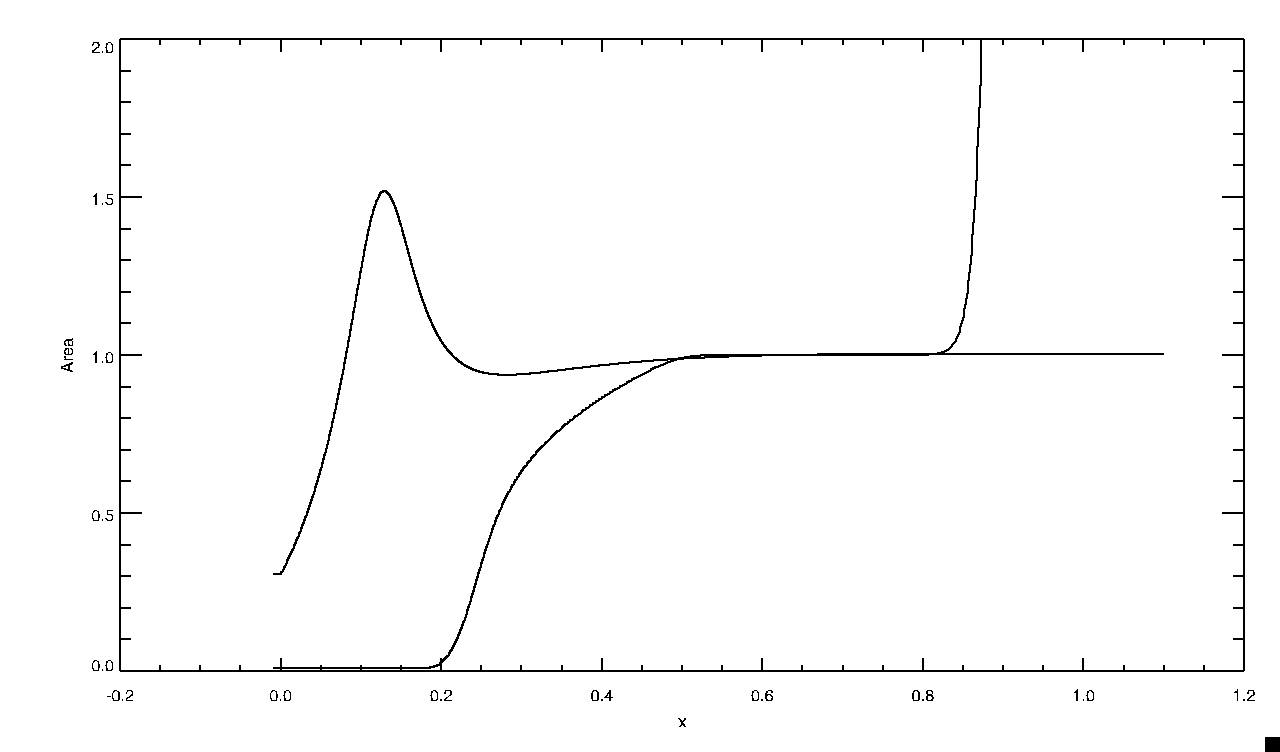 Transition region region here is lieing to the right of where dA/dx=0 (area expansion is maximum). Now that we have an idea of where the transition region is placed for the new two varied runs, here are the corresponding movies exhibiting how the behaviour of the fluid variables are altered due to altering this position: Loop A shifted to the right by 0.1 (transition region lieing to the left of max expansion) No evidence of a chromospheric shock here. The density peak formed by the condensation front that is moved down the tube by the pressure peak that is formed and into the chromosphere is less dense than for the case where our transition region lies to the right of the max expansion or directly below it. There is a small pressure wave (small peak and trough seen) formed flowing in front of the evaporation front. What is the cause of this pressure wave? Everything else between the models is the same except the positioning of our transition region. It is exclusively seen in this run. Here although we have shifted off the position of our transition region further down the loop more into the constricting region it still remains in the expanded region, maybe not directly under the greatest region of expansion though. There for we again so this very small pressure wave reflection. The loop continues to contract gradually and hence there is a small pressure build up as material tries to squeeze through this smaller region at the same speed causing the particles to bunch up together (hence see this reflected in the density profile). Comparing to are original loop A positioning (transition region was directly placed where dA/dx=0) in this case we get a large pressure wave. The transition region consists of a large temperature gradient, this large temperature gradient results in a change in the sound speed which is further accelerated as it goes through as it continues through the expanded region then is forced through a smaller area as the loop contracts causing a large pressure build up as seen in the below movie. Very persistant upflows right to end of the run. Loop A as originally placed (transition region lieing directly under where dA/dx=0 Loop A shifted to the left by 0.1 (transition region lieing to the right of max expansion) See pressure wave reflection and transmission. Right hand side of the pressure peak is where we see this reflection occuring and also the formation of evaporation front. Evaporation front moves up the loop while piston shock moves down the loop driving the condensation front down into the chromosphere (see peak in density profile and the negative velocity trough representing this condensation front). The behaviour exhibited in this positioning is similiar to that of tube B (uniform and then contracts as it enters into the chromospheric region - should be coming to an almost point source form as it reaches the solar surface). As the run evolve the pressure peak driving the upflow and downflow of material diminishes, there is still a slight peak but it is even further diminished than for loop B. The evaporation front moving up the loop is also losing speed, upflows are not as persistant in this case. The downflowing shock appears to be about to overrun this upflowing material as there is no more pressure force to drive this upflowing material. chromospheric shock is evident here, see it clearly in the temperature profile. There is no small pressure wave seen here as in the above to cases and here the position of the transition region is completely apart from the loop expansion region. This clearly is effecting the pressure and evaporation upflowing material as when we have this further pressure peak it continues to drive the upflowing material while in this case there is not that same power to continue to drive the upflowing material.
Loop B position relative to the transition region 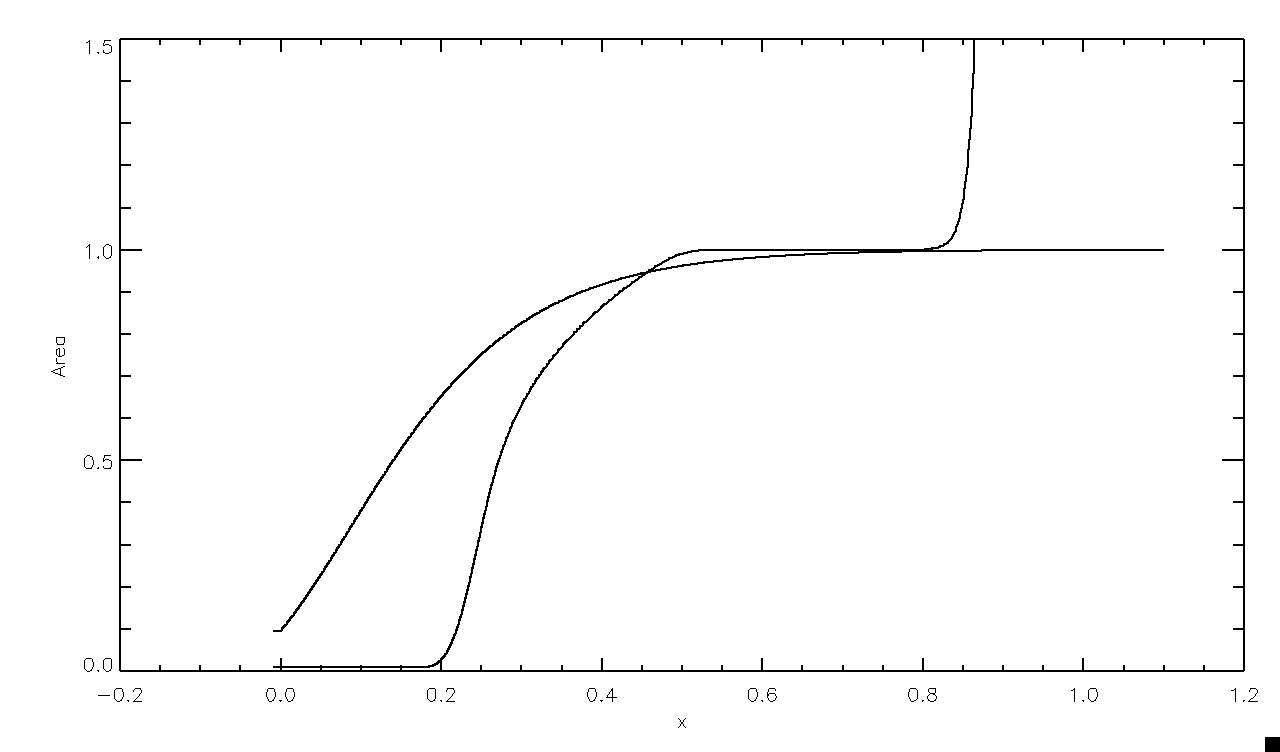
Loop B In all the above runs, the dynamics follow the same inital trend. We see the formation of a pressure peak which then in turns drives upflows and downflows (evaporation front and condensation front respectively). After the pressure peak is formed we see a peak start to form in the density profile in the chromospheric region, this is condensation front that has been moved down the loop by the formation of the pressure peak. There is pressure reflection and transmission. No pressure wave seen forming ahead of the upflowing heated chromospheric material as it moves along the loop, just see this and our original shock propogating down the tube. Pressure peak begins diminish through the evolution of the run. Have less drive for upflow material and therefore the chromospheric evaporation is dampened by the shock travelling down the loop and viscous effects start dominating. Despite this there still appears to be persistant upflowing material by the end of the run that is moving at a relatively quick speed up the loop to fill it. See the formation of a chromospheric shock This loop is very similiar to the uniform case from our original model but one key difference to make note of is that here the upflowing material is more persistant here where we have this constriction as it the loop enters the solar surface.
Loop C with area profile shifted to the right by 0.1 (transition region again lieing left of expanded region of nozzle) 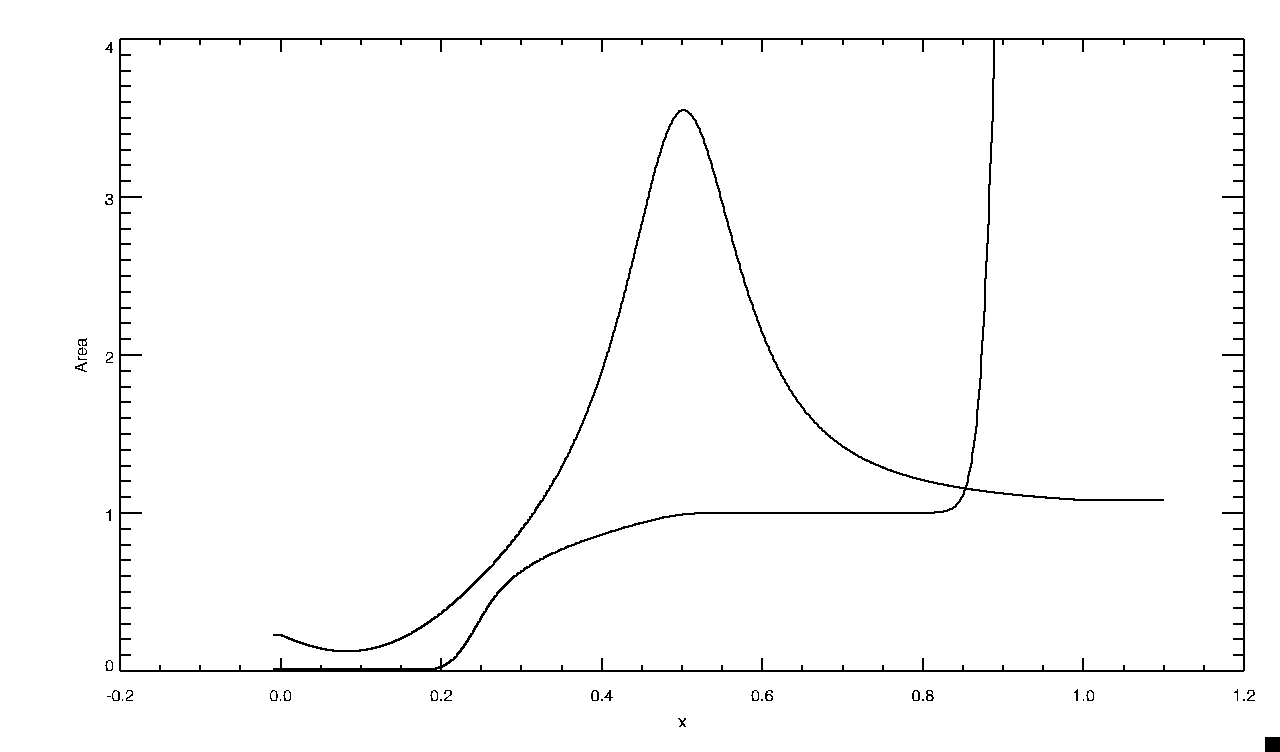
Loop C shifted to the right by 0.1 (from original position)-transition region lieing in the constricting region of the loop Here our transition region doesn't lie within the expanded region of the loop. It lies in the contracting region in this case. As in all the runs we see a pressure peak formed which drives upflows and downflows. No chromospheric shock seen formed here. Much faster for the run to come to completion and the flows here are very persistant we do not see the velocity decrease throughout the run but increase instead. Lots of chromospheric material must be moving up to fill the loop here. See a little indication of a trough and peak in the pressure profile like previously, this must have something to do with the position of the transition region where it is lieing left of the expanded region of the loop. Loop C as originally placed (transition region lieing again to the left but within the expanded region of nozzle just not directly under where dA/dx=0) 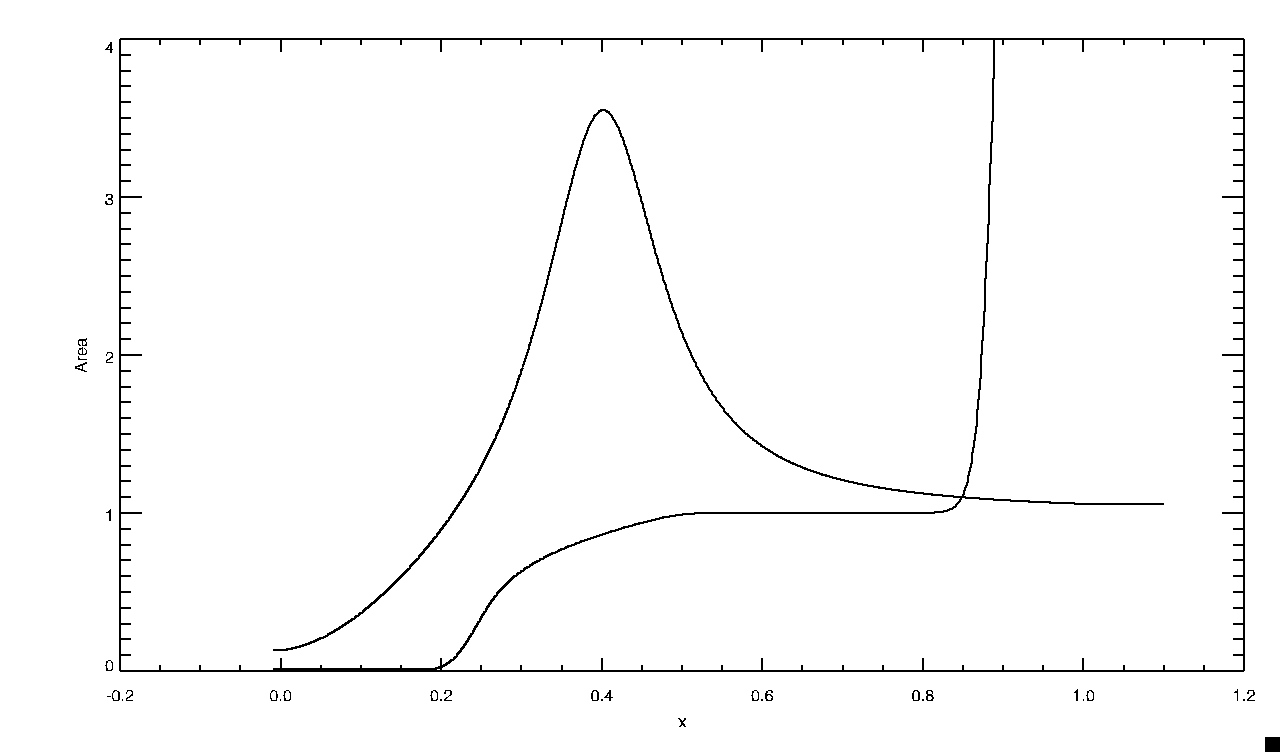
Loop C - original position with transition region lieing closer to dA/dx=0 but still off to the left Slight indication of chromospheric shock forming. See this pressure wave formed here again smaller but much more clear than in the above case where we positioned the transition region further to the left and not lieing at all within the expanded region. Here we are within the expanded region and therefore as the flow is forced through a smaller area as the transition region moves down the loop the pressure builds up and we get this reflection occuring, not a very large reflection occuring because the transition region is already partially in the expanded region therefore we dont get this additionally acceleration of the flow. Loop C with area profile shifted to the left by 0.1 (transition region lieingto the left, closer than above, to dA/dx=0- where tube is at its greatest expansion) 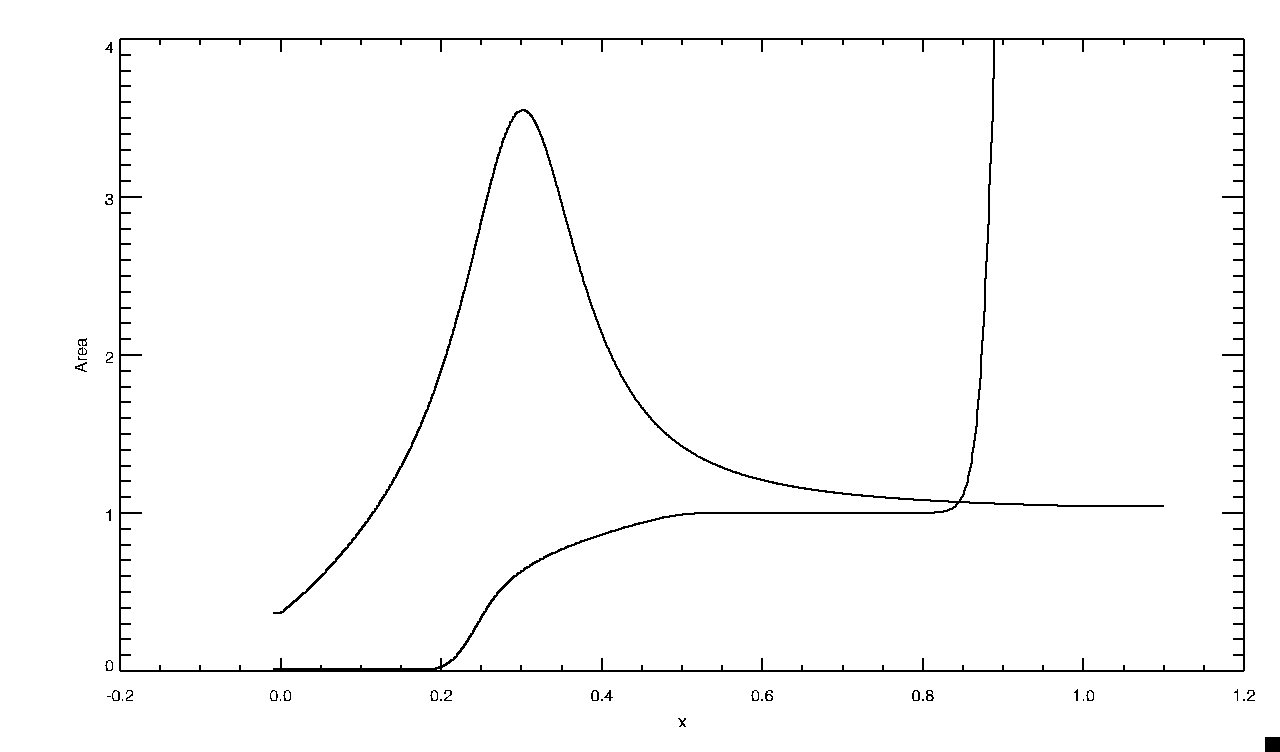
Loop C shifted to the left by 0.1 The peak in case see is larger than for loop A and therefore it constricts more rapidly to the point source form on the surface of the sun. We see a double peak formed in the pressure profile. At first it is just the original pressure peak that drives the upflows and downflows and then at the position where our transition region originally lay we get this second pressure peak forming. As the original pressure peak moves down the tube and into the chromosphere it drives new chromospheric material and this is the second peak that we are seeing in the movie that is formed and is growing in velocity while the small pressure wave in front is driving the original evaporation front that is moving up the loop but is slowing down as it moves up the loop but we will get more material moving up because of the other peak of material. This we believe is due to the positioning of the transition region in the expanded region of the loop. As material moves down the loop and the transition region also moves down the loop we get this pressure reflection due to the accelerated material trying to squeeze through the smaller region and some of it is reflecting back up the tube. chromospheric shock is evident if we look at the temperature profile. Dip in the velocity corresponds to a peak in the density profile.Velocity slows down density increases then velocity speeds up and the density decreases. Spreads out then is compressed then is spread out again. Loop C with area profile shifted to the left by 0.2 (transition region lieing directly under dA/dx=0) 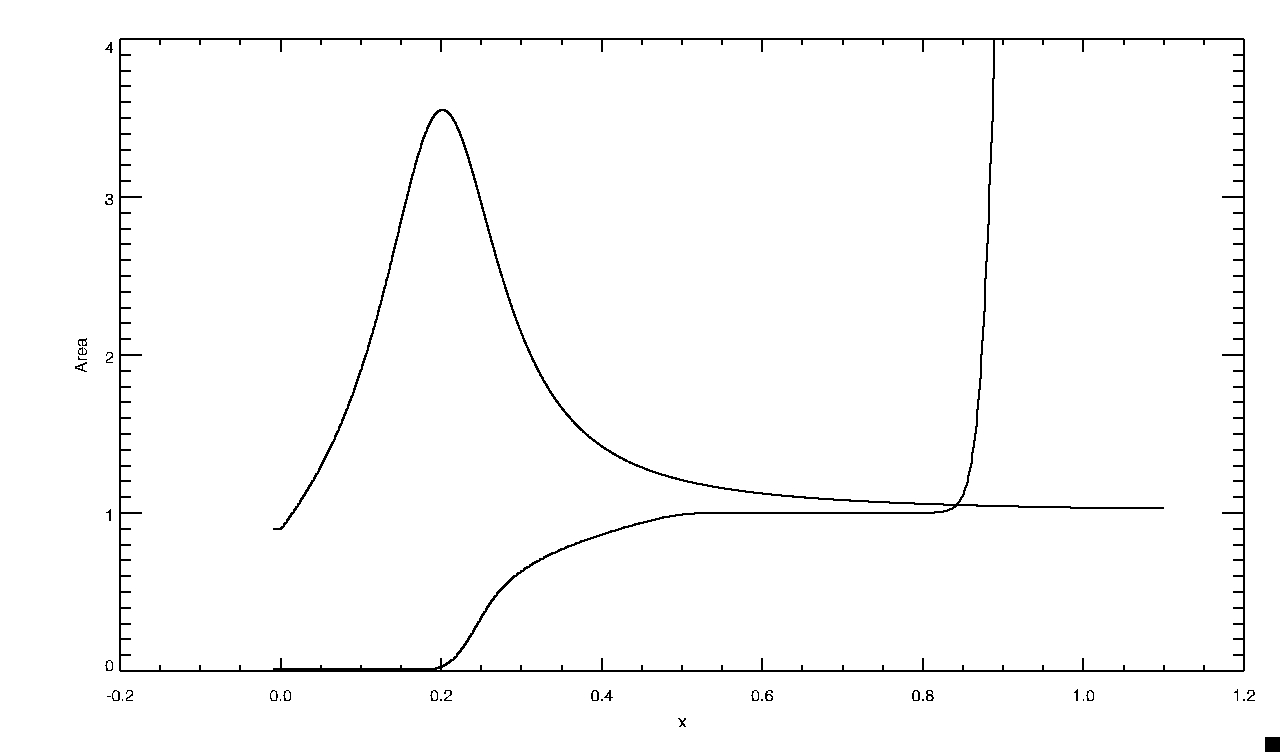
Loop C shifted to the left by 0.2 Transition region is directly placed where dA/dx=0. We would expect to see this pressure wave reflection that we saw when the transition region was place in this same position for loop A. Formation of pressure peak drives upflows and downflows. Pressure peak maintains itself as it moves into chromospheric region driving new upflowing material. This is why we see this second peak that is growing in speed moving along the tube following the original evaporation front. See chromospheric shock here Also note interestingly enough the transition region hasnt been moved as far to the left as in previous runs. e. In our model we are looking at studying the very earliest phase of the formation of coronal loops. We are focusing on the very beginning stages of upflow of heated chromospheric material as it fills the loops. In some of the runs we see sifinificant amounts of density enhancement where the corona used to be, i.e. the loop is being filled by this evaporating material from the chromosphere whilst in other cases we do not see this same density enhancement in this region. The upflows that disapear by the end of the runs will probably only fill the foot points of the loop if that and therefore are unable to fill the loop and form this coronal loop of dense material while some we see significant loop filling. Today are focus is on looking at the nine runs (uniform, B, A-0.1, A, A0.1, C-0.1,C,C0.1,C0.2) and look to see where the velocity continues increasing through out the whole run or where we get this decrease in the upflowing material with time. This will be very interesting as we will hopefully get some information in whether the loop structure effects the amount of upflow material and its ability to fill the loop. |