
Began working with the new website. I am responsible for designing it. We are switching from wordpress to concrete5 because wordpress has been problematic (it continues to be problematic I found out!). In the process I am going to be getting quite familiar with html! You can find the current website at http://ssel.montana.edu, look for the new website to be coming soon.
Some of the things I need to do with the website are: transfer everything from the old website and sync our plotting routines with the website and upload plots to it. This should be done early next week.
Day 5: Monday, June 11th
Interesting trip to see an astronaut in Helena. Had a nice walk up Mt. Helena.
Day 6: Tuesday, June 12th
Performed safe to mate on (what I believe is) the RF transmitter for the new payloads that SSEL is building with their new grant. Also, continued working on the website, looking for a good theme. Soon to be syncing python with it. All the content has been transferred over.
Week 4: Monday, June 25
Last week continued working on the website and began reading Introduction to Geomagnetically Trapped Radiation by Martin Walt and Radiation Detection and Measurement by Glenn Knoll. Both will be important in understanding data coming from E1P. The first in understanding what we are investigating (electrons trapped in the radiation belts) and the second in how the radiation is measured. Today I also began reading The Electron Radiation Belt (Li and Temerin, 2000) and will continue with that tomorrow.
I also will begin working on the scripts for the website, putting all the data in one easily accessible place and writing scripts to put all the data together. Hopefully this can get done this week or next and we can really begin looking at the data from E1P. I'm excited to dive into this and enjoying the papers!!
Week 7: Monday, July 16
Have not updated the log for awhile, so here goes with a lot of information:
Gave a presentation last Friday as a midway check-up on the work I am doing. I presented about data analysis for E1P, which is MSU's satellite in orbit right now. The presentation can be found here.
I will now be working on:
1. Plotting graphs for each day of E1P data that we have and placing them on our website.
2. Investigating days where we appear to have had interesting events happen.
3. Comparing flux from E1P with flux from NOAA POES satellites.
4. Continue reading from Walt's book, reading about how Dst and Kp Indexes compare with actual activity and reading other relevant papers.
I have accomplished:
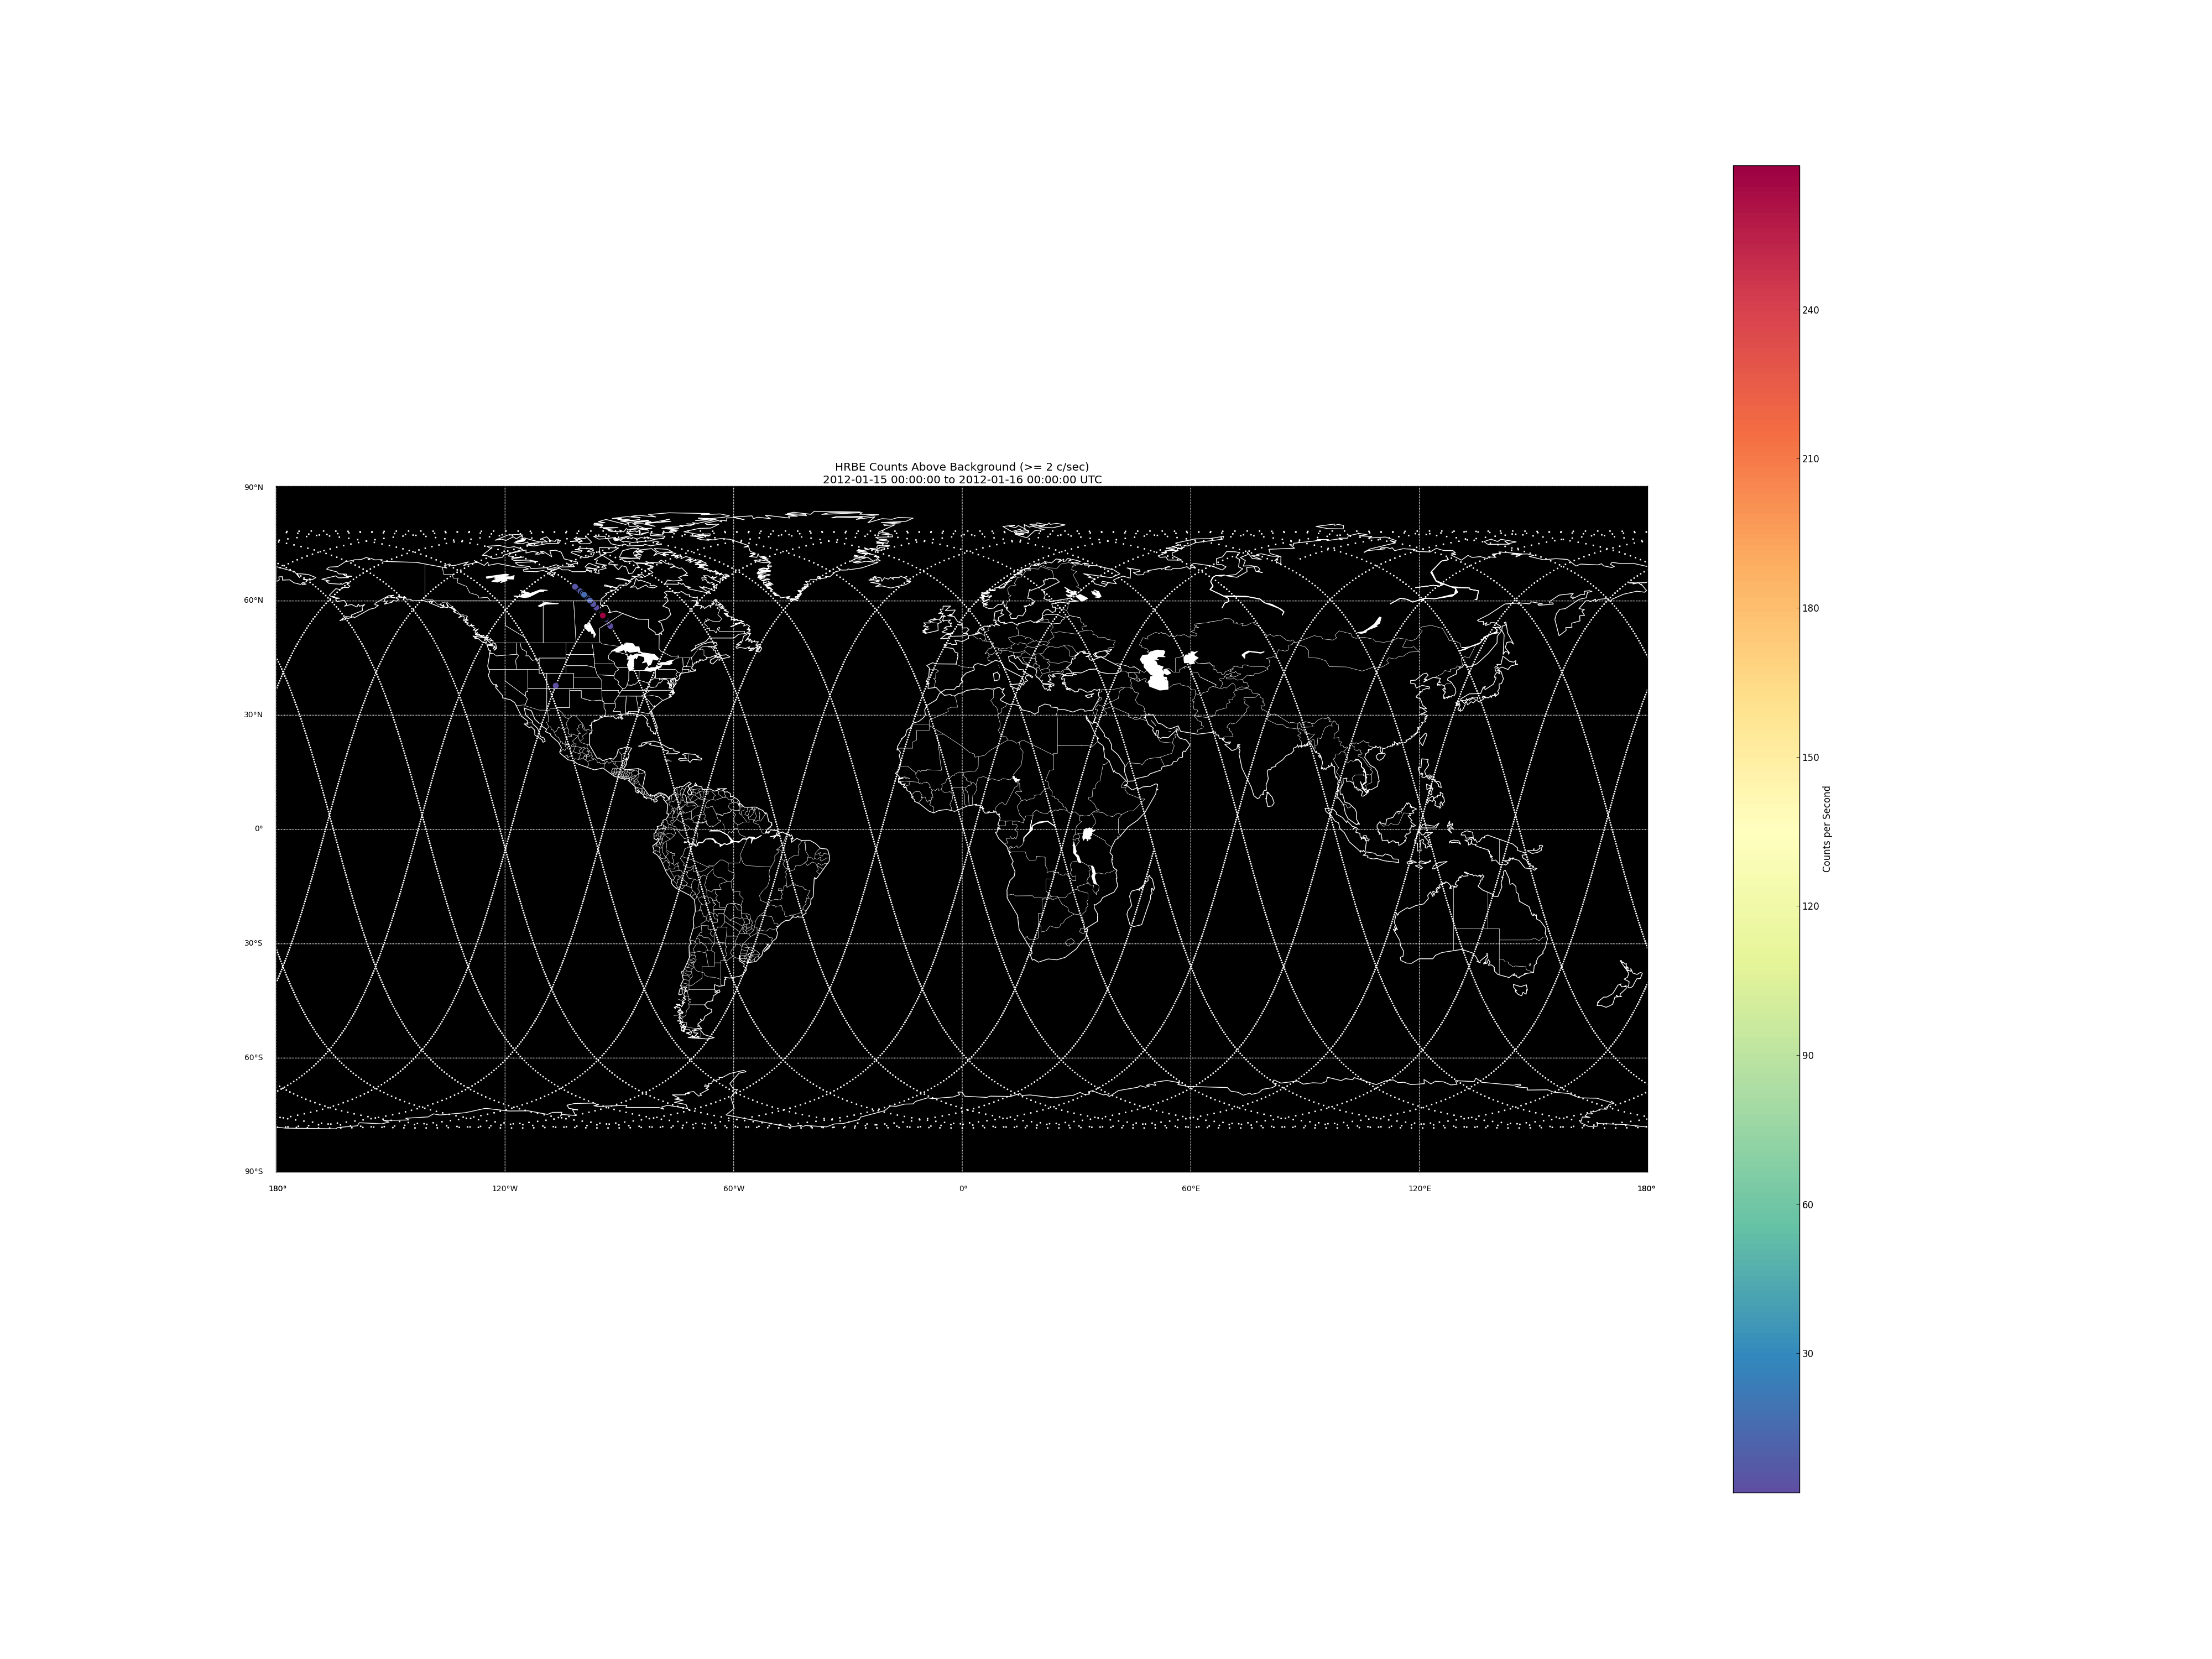
1. Made plots of global data from E1P. We have plots showing total E1P coverage, counts in terms of L-Shell vs. Kp/Dst Index, and histograms of total counts from E1P.
2. Accounted for problems in the histograms that resulted from E1P setting the Geiger Tube voltage too high.
3. Understand adiabatic invariants in relation to charged particles in a magnetic field (plasma physics) and the equations of motion for single particles in a plasma and how this relates to particles in the radiation belts.
4. Read several papers (Li and Temerin, 2000) relating to the radiation belts.
Week 7: Wednesday July 18th
It's Heidi's birthday! Got up early for pancakes, a great start to the day!
In other news: Check out this link and click through the directories to find all the E1P plots for days with >= 5 counts per second occurring at least once. Telemetry data for the satellite can also be found under the heading "Housekeeping".