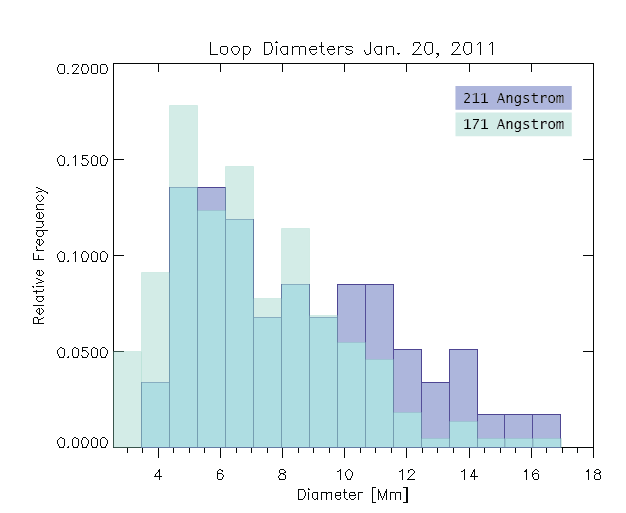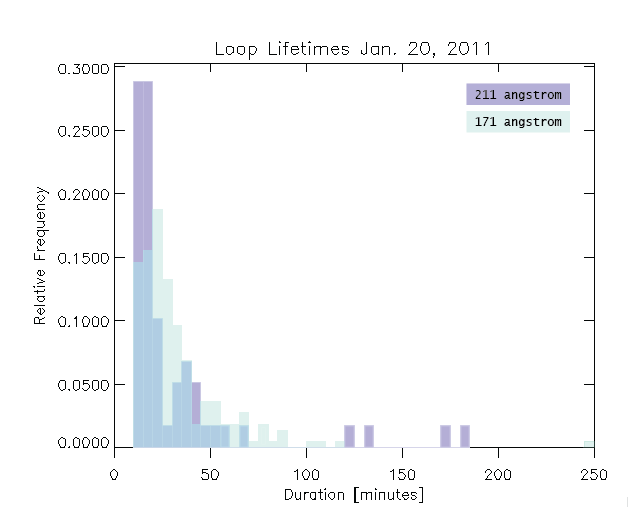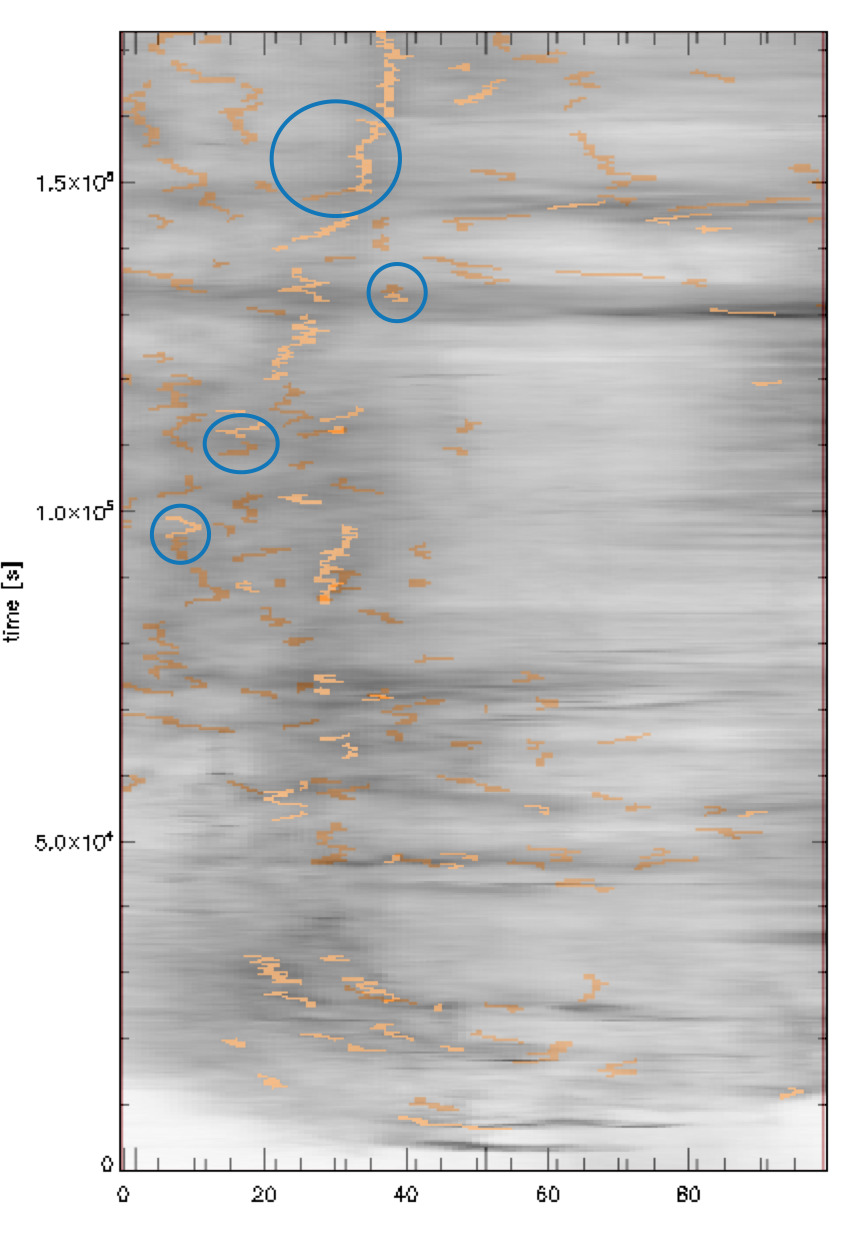
The highlight of this week was the midterm presentations on Thursday. Prior to the presentation, I worked on comparisons between Marika's 171 angstrom data and the 211 angstrom data in order to continue the discussion from last week's group meeting at the midterms. The average duration of loops between the two wavelengths was almost identical (31 minutes for 211 and 32 minutes for 171). The average diameter was larger for 211, but only slightly (8.5 Mm compared to 7 Mm). I also created an overlaid stackplot of both wavelengths and found some cases where it looked like loops were heating up over time (from the cooler 171 wavelength to 2 million Kelvin in 211). I want to expand the slit width for my stackplot in order to investigate more cases coronal loops heating up or cooling down.


