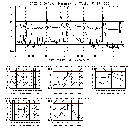

This is one of our usual plots, showing the GOES soft X-ray burst (yellow line) and Yohkoh SXT image times (red and blue tick marks and rectangles). The flare occurred precisely during routine "orbit night" (from 13:40 to 14:11, see the dashed lines in the plot) that occurs inexorably every 96 minutes due to Yohkoh's low Earth orbit. Virtually a complete miss! But read on, there was a nice little discovery after all...
This event was a fast one, not the sort normally associated with a coronal mass ejection, as the routine Nobeyama 17-GHz images below show:

The images above cover twenty minutes - before and after, the normal
distribution of microwave sources here and there on the Sun, notably the
large sunspot group (NOAA 9236) just N of disk center.
The image in the middle shows noise induced in the image formation by
the flare - Fourier transforms gone haywire.
We apologize to the
Nobeyama Solar Radio Observatory
for showing this
bad version of their fine data, and look forward to seeing better versions
later!
There is no question from this figure regarding when and
This flare occurred in the wrong region, which did not alert us ahead
of time with a
sigmoid
structure.
We had been observing a different active region on behalf of a
coordinated campaign
(MEOC)
dedicated to global waves, and in fact probably all observatories
with small fields of view missed this one -
even if the Earth had not gotten in the way, as it did for Yohkoh
(this has got to happen more often than cold logical statistics would
predict!)
But the planners trying to anticipate this sort of flare did say,
and we quote, "...target AR9231 resulted in increased complexity. This region
continues to be the region with highest potential for flares with wave
effects and CMEs." - wrong region!
Did Yohkoh strike out completely?
Let us see if this flare exhibited "global restructuring", ie large-scale
coronal changes.
This might not be expected, given the close associate of slow flares (the
so-called Long-Decay Events) with coronal transients.
The images below show several steps in searching for global effects via
before-and-after difference images:
Making a difference image (a pixel-by-pixel subtraction of images at two
different times) emphasizes changes.
This simple technique can often cause confusion, as we see below, but (as
we see still further below) it often leads to discoveries too.
In the images above we see that, yes, a flare occurred, and yes, there are
large-scale effects - so far, so good.
So was there a global wave launched from this flare?
The
Culgoora
radio observatory in Australia promptly reported a type II burst, which we
can show you via this
"dynamic spectrum"
from the
Hiraiso
observatory in Japan.
The difference image above, over a short time range, shows a huge dark
region surrounding the flare site.
Is this evidence of a wave propagating away from the flare?
No - it's just scattered light diminishing.
This gives us a little warning about the pitfalls of "running differences",
a data-analysis tool that can and does fool the experts all the time.
A running difference is an image made by subtracting two consecutive
images.
This flies against the laudable maxim, "never differentiate data".
Above, a more serious difference image, made from a pre-flare reference
image, and expanded a bit.
This sort of procedure follows the meritorious principle of data analysis,
"see what happens if you subtract the background."
Now we see the discovery!
The arrows point to where the corona has thinned out visibly.
This may represent a heretofore-unrecognized form of
X-ray dimming
associated with the formation of a coronal mass ejection.
TBD - a work in progress - but this is getting interesting...
We are waiting patiently to see if the
LASCO corongraphs detected a CME before we actually
predict one!
(Note added in proof Nov. 26... yes, there was a halo CME, we get to pat
ourselves on the back.)
Either way, we see here the revenge of the observers - never mind that
Murphy's law ensures that interesting flares always happen at night; we
can still make progress.
We are in great luck.
As soon as this science nugget was written, complaining about the poor
timing of the first X-class flare, a whole series of them occurred with
perfect timing.
Five M or X-class flares in a row occurred during Yohkoh orbit
day, outside the SAA, and during times (we think) when data were being
recorded - for example:
(click to see five examples, including four of the good ones;
the hashmarks on the time-series plots show
where there is unlikely to be data coverage).
Of course we'll do another science nugget on what we saw during this
exceptional set of events.
November 24, 2000
Murphy's law zaps the MEOC campaign
But wait!


Conclusions
Postscript: Murphy's law proven absolutely!
