This week we have had four M-class flares after several weeks of their absence. See the following GOES plot (click to enlarge).

Three of them, as indicated by tick marks, have very spiky time profiles. A previous nugget discussed the possibility that characteristics of the flare including the time scale of variability may depend on which active region produces it. Indeed, all of the three flares that changed rapidly originated from AR 9368.
Unfortunately, the first two occurred during Yohkoh night, but the third one occurred during the last pass of the week, coming as a big present to us so that we won't get bored during the weekend. The following figure, carrying light curves from GOES and HXT, confirms its short duration. The HXT data show that the flare had a quite hard spectrum, and we were able to make images in the highest-energy channel (53-93 keV) of HXT.

The short time scale indicates that the flare is spatially small. It was indeed small, as described in a real-time report from KSC, the Japanese operation center. The following figure shows an SXT image taken 3 minutes before the hard X-ray flux started to increase, superimposed (as a contour map) with a hard X-ray (53-93 keV) image around the peak, and an MDI magnetogram rotated to the time of the flare. The soft X-ray flare occurred at the same location as the pre-flare brightening shown in the left panel.

In the above figure, the MDI magnetogram was obtained as a gif file from the SOHO summary data site. Note in the right panel the small white (positive) polarity at the northern end of the area of predominantly negative polarity, as indicated by an arrow. This seems to correspond to a foot-point of the flare loop (marked by the hard X-ray source.) Although we do not know the causal relation as indicated in the report from KSC, the flare site indeed corresponds to emerging flux in the following polarity area of AR 9368.
Whenever a major flare occurs, some of us would ask if it is eruptive. We know of many good examples of eruptions as seen with SXT, as we have reported many times here, especially since we started taking saturated, large FOV images more frequently. This flare was not spectacularly eruptive. But larger loops in the center of the left panel of the above figure (connecting the preceding and following polarity areas) gradually became brighter, indicative their connection to the compact flare.
The following figure shows an EIT difference image to indicate the dimming region. The dimming region is compact, to the north of the flare. Interestingly, this is another example, where dimming was not seen at least until the flare brightening started. That is, the dimming was not seen at 04:02:26. This is in sharp contrast with the 1998 April 27 event. These authors claim that the coronal mass ejection (CME), as identified with EIT dimming, preceded the flare by 45 minutes. But bottom line is we do not really understand what EIT dimming means in the whole process of a CME.

Speaking of CMEs, yes, our flare was associated with a CME. See the following LASCO C2 images (taken from a quick-look movie site). We do not see anything at 04:06, but the central image at 04:28 shows something coming out in the northwest direction (already at 2 solar radii above the limb). The ejection was almost out of the C2 field of view at 05:36.

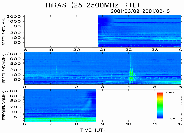
We calculated the CME speed (in the plane of the sky) was 750-800 km/s, and the real velocity must have been high enough to produce a shock in the low corona. A metric type II burst is reported. The following figure shows a dynamic spectrum taken with the HiRAS telescope at the Communications Research Laboratory. An expert would easily be able to see a type II burst.

Lastly, although the flare occurred at a preferable longitude (W42) on the Sun in terms of connectivity to Earth, there was no big proton event associated with interplanetary shocks. The following plot shows a record from GOES.

The 2001 March 10 event may be called a usual flare, but things to note include: (1) it occurred at relatively high latitude (N28) at this phase of a solar cycle, (2) it had a small soft/hard X-ray flux ratio (pronounced acceleration with respect to heating), (3) it was associated with the compact parasitic polarity.
It seems that the hard X-ray foot-point corresponds to a stronger magnetic field, contrary to a general concept that nonthermal electrons more easily stream into a foot-point of weaker field. Then, isn't it possible that the northern end of the loop is actually not anchored, i.e., geometry for a jet? One can speculate anything in 3-d from 2-d images. I think of upward escape of electrons.
I have recently learned that CMEs associated with impulsive flares are not particularly rare, see Kahler, Sheeley and Liggett (1989), and the associated CME had a narrow angle in our case. But an interesting thing is that a metric type II burst was produced. Metric type IIs are often attributed to blast waves from flares, and that is probably why we often see metric type II bursts during long decay (duration) events (LDEs). But the thermal energy input is very small in our flare. Does the location of the event matter for the generation of type IIs? Concerning the absence of major particle events, is it possible that an interplanetary shock was generated but that it did not intersect the ecliptic plane because it moved predominantly northward?
Lots of homework and anticipation for more events.
11 March 2001