Footpoints slipping along
Two issues ago we defined "footpoints" and discussed some of their behavior. To summarize briefly, the footpoints show us where the coronal magnetic energy release winds up, and mapping these footpoints back into the corona (if possible) will eventually show us where the energy came from
What we describe in this nugget came from the mini-workshop at the Nobeyama Solar Radio Observatory associated with our recent "Project Galileo" discussions there. This project aims at archiving the quite rich Yohkoh database in such a way that future researchers can deal with it - documentation, stable formats, etc., not an easy task.
We have long known that bright solar-flare emissions come from closed magnetic field lines, that is small or large loops extending from their footpoints up into the corona. Furthermore, these loops trap particles, which are constrained essentially to move parallel to the field and cannot leap from loop to loop easily. More than that, we know about trapping. This subject goes all the way back to Birkeland, Poincare, Stoermer, and of course Van Allen. Electrons appearing in a coronal loop may stay there, spiraling and bouncing in a fairly stable manner, until they "precipitate". While spiraling they emit radio waves, but only when they actually stop do they make hard X-rays; hence there is a notable delay between hard X-ray and microwave emission:
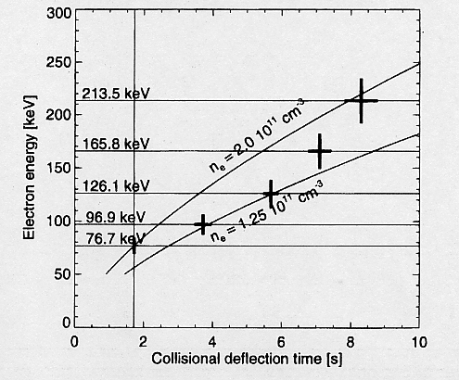
The presence of this trapping effect will help to determine the time variations of the footpoint sources, which we can track with Yohkoh HXT images. Aschwanden argues that there are two effects: first, a dispersion for the directly preciptating particles, in the sense that the higher energies come earlier; second (illustrated above) the "detrapping" implying that high energies come later because of their longer Coulomb collisional time scales. Recognizing this distinction marked an interesting step in our understanding of the impulsive phase.
Oddly enough, this is the first Yohkoh science nugget dealing with this huge event (an X9.4, perhaps the most powerful flare well-observed by Yohkoh. Because of its energy, the hard X-ray fluxes are large, so it is ideal for us to use in studying footpoint behavior.
Here is an overview in two figures:
The rather neat figure below shows a suggestion that illustrates the power of our footpoint mapping. Not much work has been done in this area, but it is an active subject both for Yohkoh and also for RHESSI, the new spacecraft.
If correct, this displacement calls into some doubt the simple classification into prompt and trapped populations. A one-second time scale is shorter than that found by Aschwanden. This could simply imply higher densities, not too implausible; alternatively, this could be evidence for a longer acceleration time to the higher energies. This too is not too implausible, since nobody expects that particle acceleration really will be instantaneous. Finally, it could also point to pitch-angle distributions, something we have not discussed yet.
This wealth of possibilities should not alarm us. This is just one flare, and the analysis here is more intended as a comment than a finished product. We can learn much, much more by folding in the microwave data and by doing fuller analysis on the X-rays themselves. The very encouraging thing here is the manifest ability of a hard X-ray imager of this type to generate precise image locations at high cadence. The precision appears to be limited mainly by the photon counting statistics, in fact, better than which one should not be able to do.
July 26, 2002
Satoshi Masuda (masuda@stelab.nagoya-u.ac.jp); Hugh Hudson (hudson@lmsal.com).