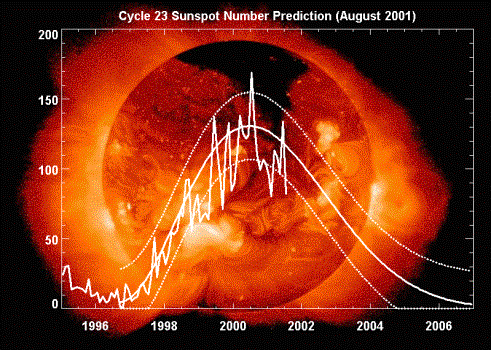
Sunspot activity follows
an 11-year cycle
Traditionally the number
of sunspots defines the rise and fall
of solar activity. This chart shows that
sunspot activity reached its peak level
or “solar maximum” around mid-2000.
Smooth
solid line is current prediction; dashed line represents the range of
predictions; jagged line
shows actual numbers to date.
