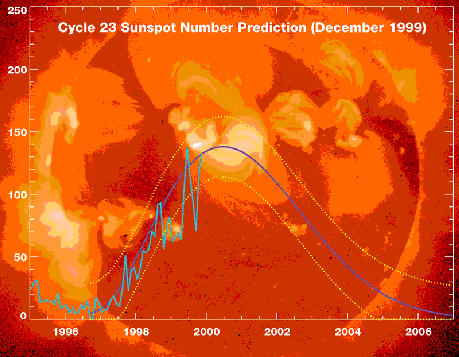
Sunspot activity follows
an 11-year cycle
Traditionally the number
of sunspots defines the rise and fall
of solar activity. This chart shows that
the Sun may approach its peak level
or “solar maximum” around mid-2000.
Dotted
yellow lines represent range of predictions; light blue actual numbers to
date.
