| Wednesday 8th June So for the last few days I have been looking through EIS data for active regions from the last 6 months. We wanted to find coronal loops that were well-defined and stable (we avoided dates on which flares occured) which may be suitable for further study. Once dates and times were chosen I searched for AIA images beginning at the chosen times and sampled every 3rd following image for 1 hour. We wrote a subroutine in emacs which when given the x and y centres, EIS fields of view and start time calculated the new positions of the region as the Sun rotated and cropped the images to include just the region of interest. From the frames I made the movies below; April 19th 2011; This movie is on the wavelength 335, which doesn't give as clear an image at the higher temperature. April 19th 2011; Here the wavelength is 94, slightly clearer. April 19th 2011; Wavelength 171, the most detailed. March 20th 2011; Wavelength 171. May 6th 2011; Wavelength 171 again Thursday 9th June Today was spent mostly working on this webpage, downloading more images for tomorrow's presentation and putting together the presentation itself. Lost time in the afternoon because the images that I spent ages making in different colours to indicate different wavelengths didn't actually save in colour. I saved them as the wrong type of file and ended up with a load more grey images. Eventually got it sorted. So here are some SDO AIA images of the most promising (for our purposes) looking loop, from April 19th, in glorious technicolour (the numbers at the top of each image give the wavelength); 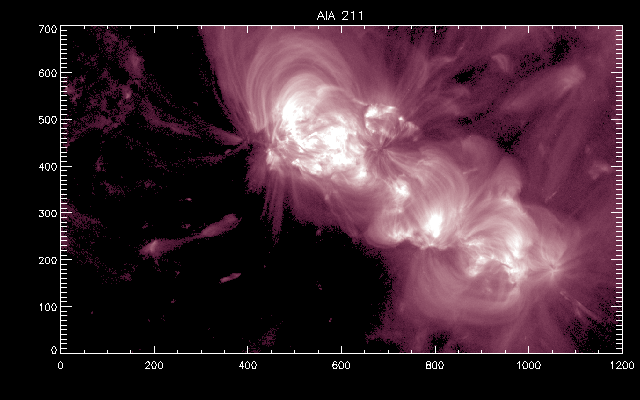 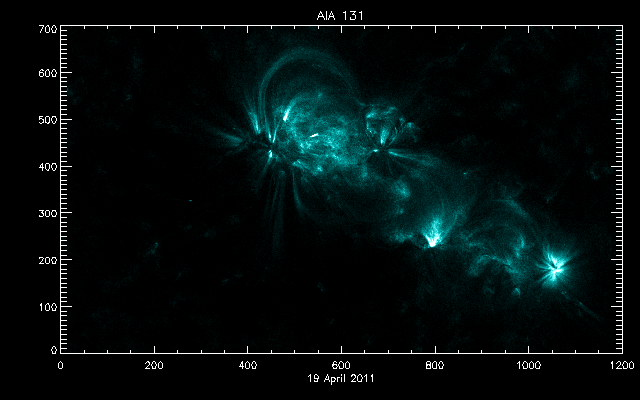 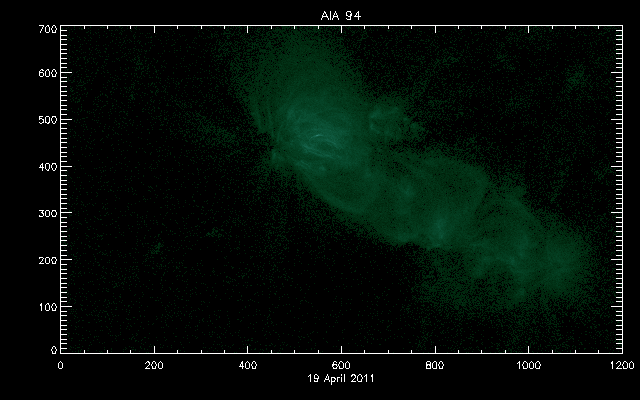 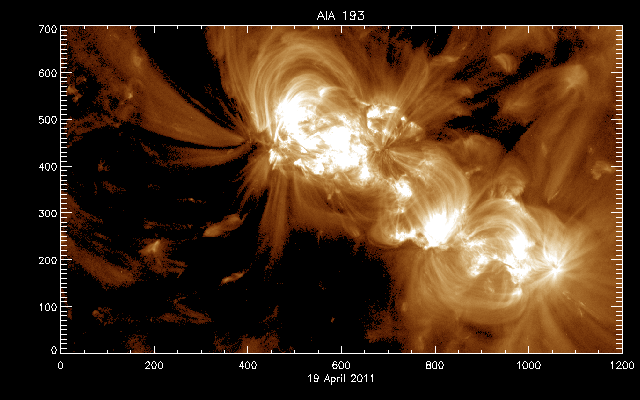 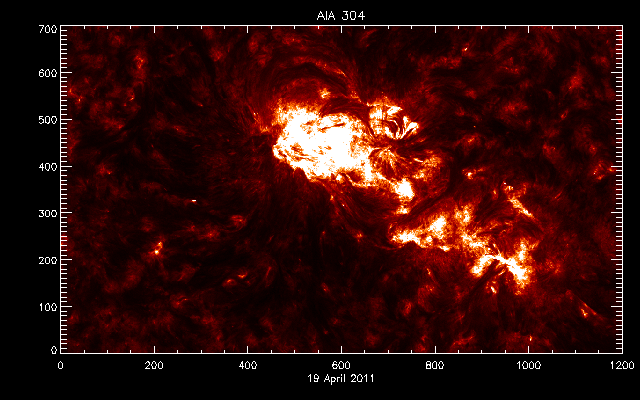 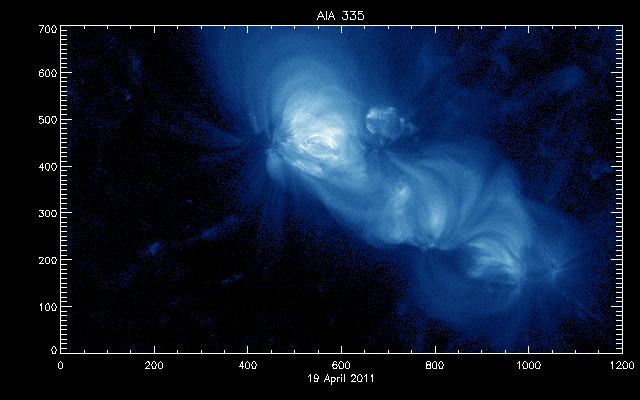 I might be able to put the presentation up on this site too, once it is completely finished. Friday 10th June On Friday morning Rahul and I worked on getting the last few images for the presentation and finishing it up properly. It went ok, and it was good to see what everyone else is up to. Then we had to start prepping some EIS data and running the programs which allow us to make .map files of the images. Once we have the .map files for both the EIS images (which give useful spectral data but not such high resolution) and AIA images (which gives higher resolution) we can start to co-align them, which will allow us to pick out features and trace the loops. Don't have much to show you but I'll put the presentation up in the 'additional info' section. Monday 13th June Today I made the EIS .map files for 195 and 202 and figured out how to use 'Wilma', a GUI which will allow us to manipulate the .map images. I've also been trying to write a program which will make .maps for the AIA data. Let's say it's not quite there yet... Tuesday 14th June Breakthrough! Today I actually got my aia .map file routine work. So I got the files for AIA 193 and 171. I played around trying to overlay EIS 195 and AIA 193 in wilma, I can zoom in on regions, label features, and make it all sorts of pretty colours. I wanted to put some of those up here, but at the moment I'm not getting the images to save in colour again. I'll figure it out and upload some soon. The next step is to properly co-align the images. We also had a seminar on Condensed Matter. Thursday 23 June Since the last time I updated this log I have been mostly co-aligning. Using an AIA image slightly larger than the EIS field of view so it can be shifted around I've been using plot_map to blink between the AIA images and the EIS image to spot differences in the positions of features. I can alter the AIA image x and y centres and rotate the image to line it up with EIS. I am nearly finished aligning all the AIA wavelengths to the EIS image. To check how well they are coaligned I can plot the intensities to see if the two images give similar curves. I have also used eis_fit procedures to make fit_struc files of the EIS wavelengths. Finally I have made another movie of SDO AIA images starting 15 minutes before and ending 15 minutes after the EIS raster for the active region, which also displays the times when the images were taken. EIS 'rasters' by imaging through a small slit, we are using images created with 1 arcsecond slit I.D, for a certain exposure time. It then moves along and images another small strip, and the full image is built up from the strips. So as you move across the image from right to left you are seeing the region at different times. In this image; 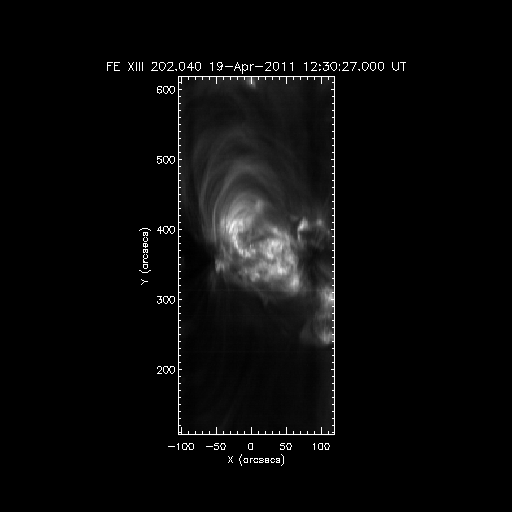 EIS started rastering at around 12:30 (right hand side) and finished at about 14:33 (left hand side). This is the movie of AIA images of the same region; Movie193 Here is a screenshot of the curves for EIS 202 and the aligned AIA 193 images; 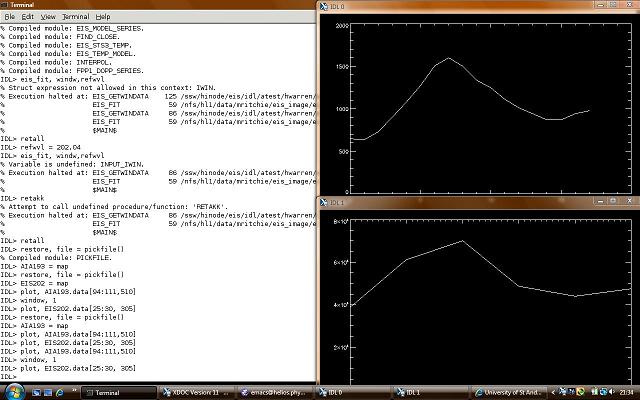 So the two images corresponding to these curves are well aligned. This is the AIA map which has been aligned with the EIS 202 image; 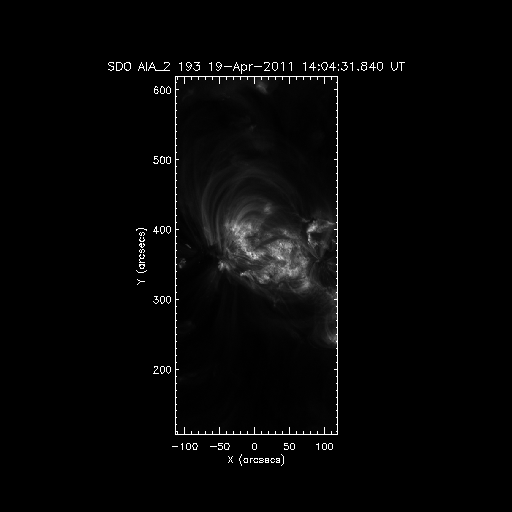 Wednesday 29th June REU group meeting summary of progress; -Since the last presentation we have been carrying out data analysis on a stable coronal loop from April 19th. The first tasks were to create .map files from EIS (Extreme Ultraviolet Imaging Spectroscoper) and AIA (Atmospheric Imaging Assembly) fits files to allow manipulation of the images. The EIS raster had to be prepped to a level 1 fits file. Then we used the procedure mk_eis_map for EIS, and wrote a short procedure mk_aia_map to make the AIA maps. We used x and y fields of view (FOV) which were 10 arcseconds larger than the EIS FOV to allow shifting of the AIA image when coaligning; 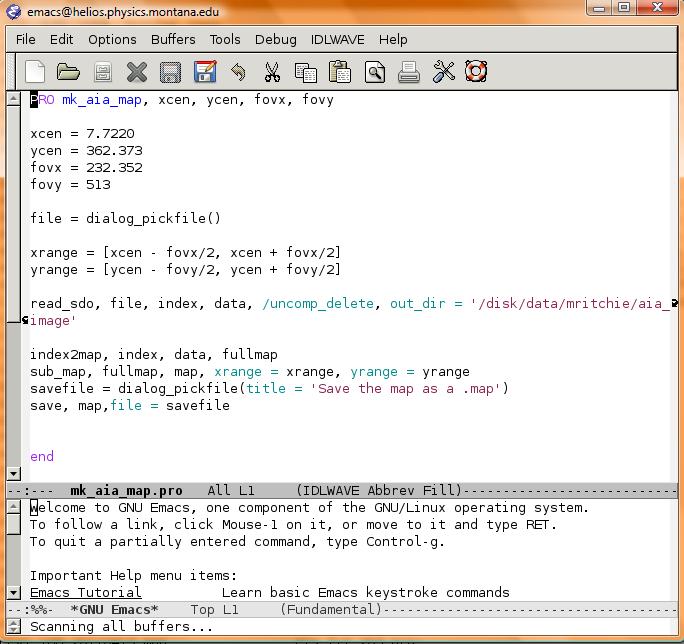 -We have also been using 'Wilma', a GUI developed by Trae Winter and Jason Scott. In later stages it has been useful for checking coalignment and tracing loops; 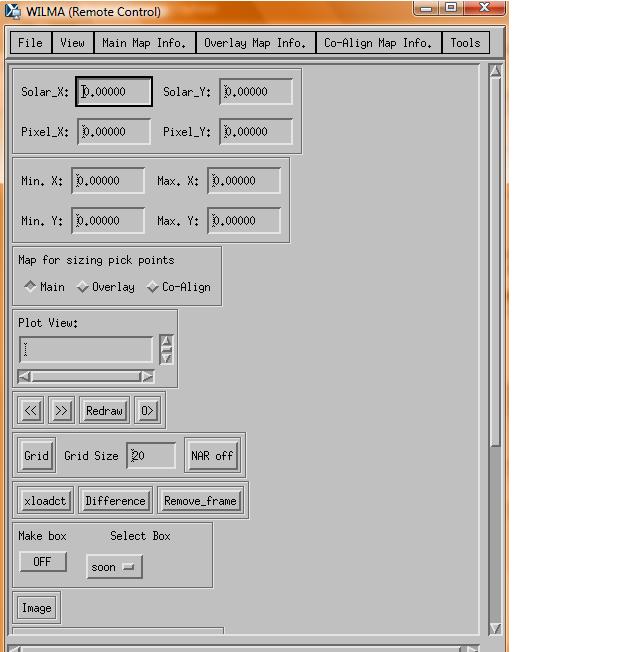 -Coalignment - we want to know that the pixels we are looking at in AIA contain the same features we see in EIS at those pixels. With guidance from Jason started by coaligning AIA 193 and EIS 202. There is an interesting feature on the EIS raster which was imaged at 14:04, so we began with the AIA image from around 14:04. From making a movie of AIA images starting 15 mins before and ending 15 mins after the EIS raster we could see that the feature was stable; Movie193 - Used plot_map to blink quickly back and forth between the images to spot shifts in the positions of specific features and altered x and y centres of AIA accordingly.   It was possible to check the coalignment in wilma;  Rahul has also coaligned AIA 193 and EIS 195; 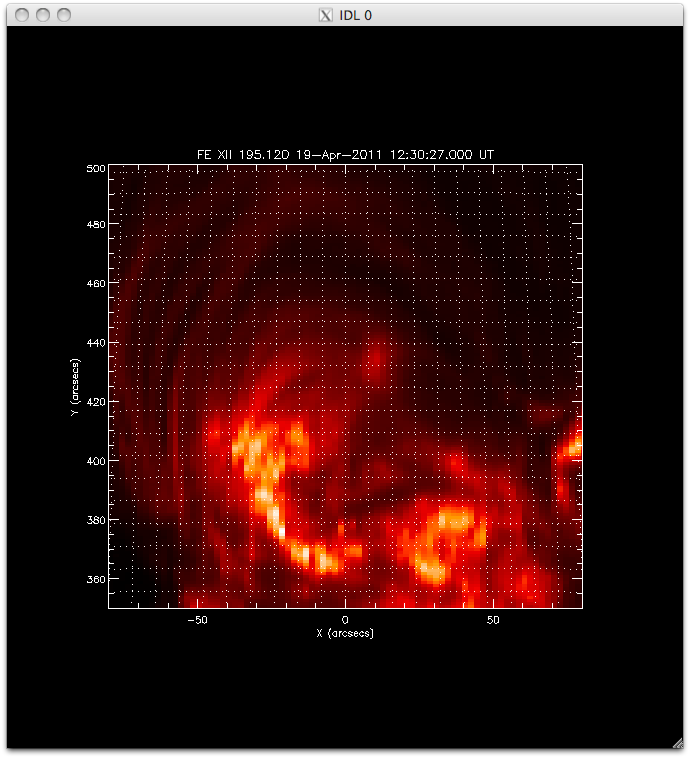 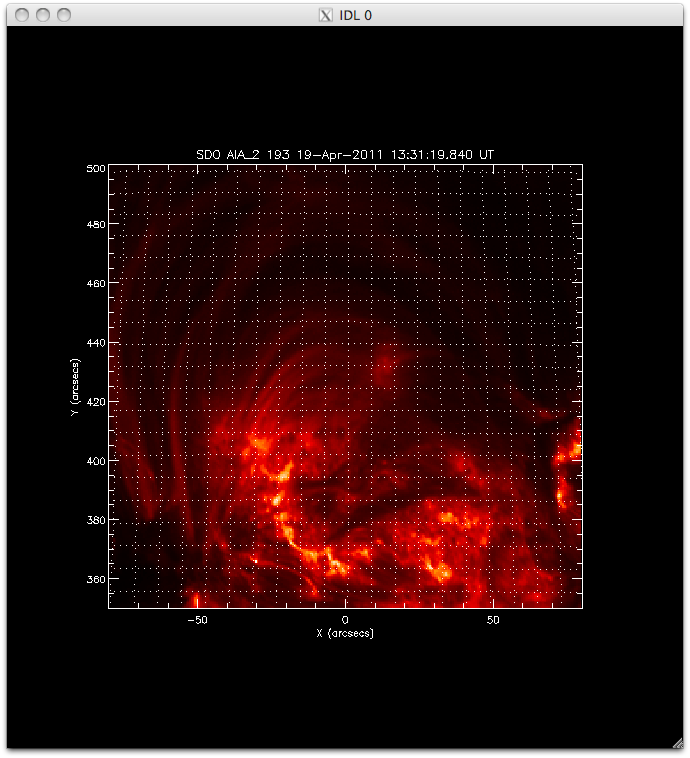 We then worked on inter coaligning AIA 211, 94, 131, 171, 304 and 335 with the aligned 193 image; 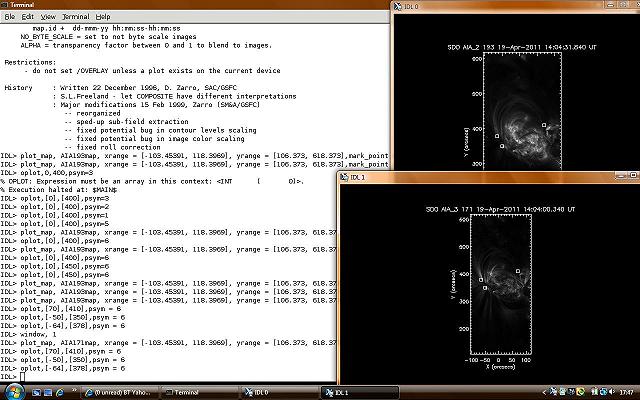 -Currently we are working on tracing loops by using Wilma to label points on AIA wavelengths that are also visible in the EIS raster. We have been able to record the picked points in solar cartesian coordinates and also the pixel positions, but there have been problems reloading the points in wilma. It would also be useful if we could superimpose the points selected in one wavelength onto another to see how the correspond. Here is a png image of picked points in wilma; 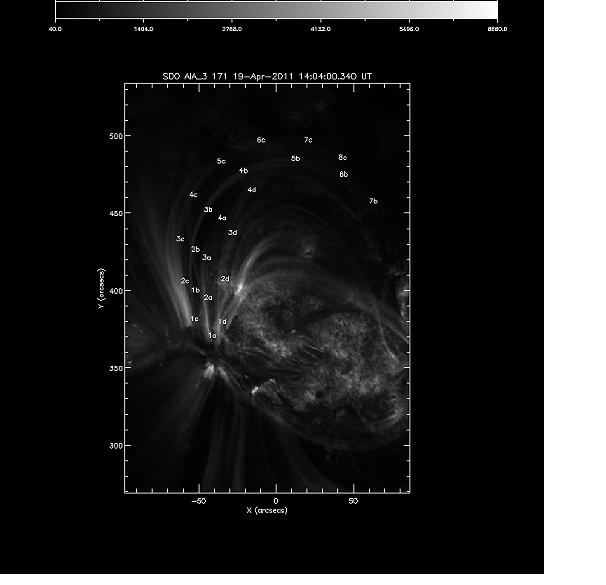 -Next step will be to perform background subtraction. Tuesday 12th July Since my last update we have traced lots of loops in the AIA wavelengths. Some of the wavelengths are fuzzier than others and it can be difficult to see sometimes where loops are going, they can cross over and clump together, so appearing less defined. We have been using Wilma again to zoom in to see as far as we can what's happening to particular strands. I have been through 5 of the AIA wavelengths (it's difficult to see any specific features in 304 and 335) and traced as much as I can, some at different times during the EIS raster, but mostly at 1404. It is also difficult to find complete loops that are visible in all the wavelengths, many of the tracings are only of partial loops because the strand fades away in that wavelength or it becomes mixed up with others. We are for the moment concentrating on one particular partial loop, the roughly vertical loop at 1404 in the EIS raster (traced in image below). Also, using Wilma to save the picked points as an array of maps to a map file and programs that Joe has written I can obtain and image of the traced loop 'straightened out' and overplot a line through the centre. These are pngs of the picked points on the loop of interest in AIA 193 and 94, as you can see it appears differently in each; AIA 193; 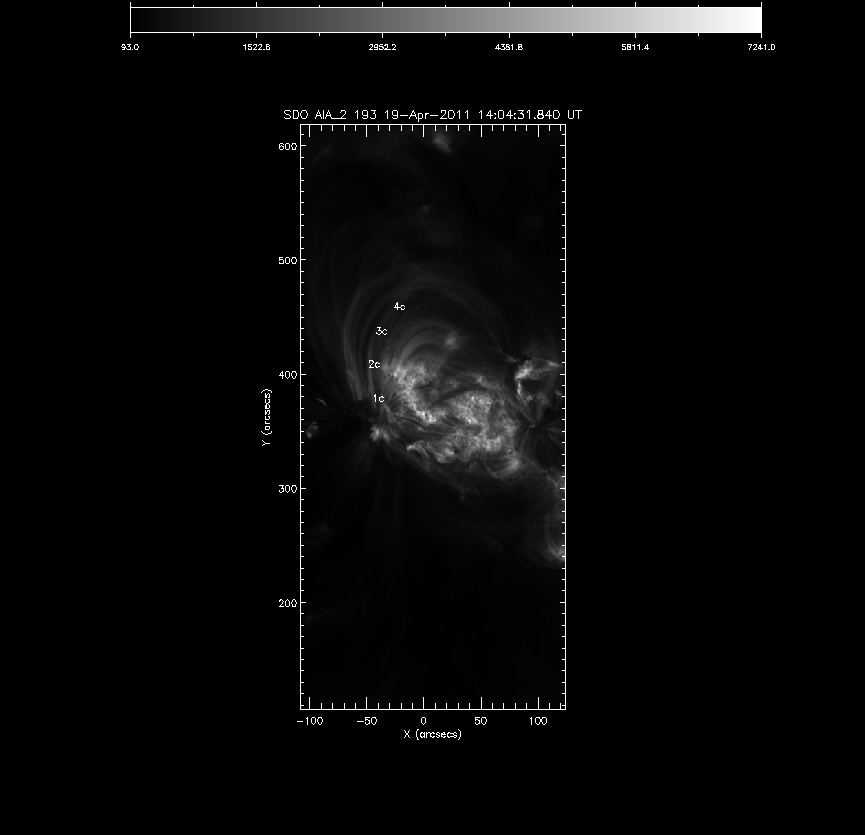 AIA 94; 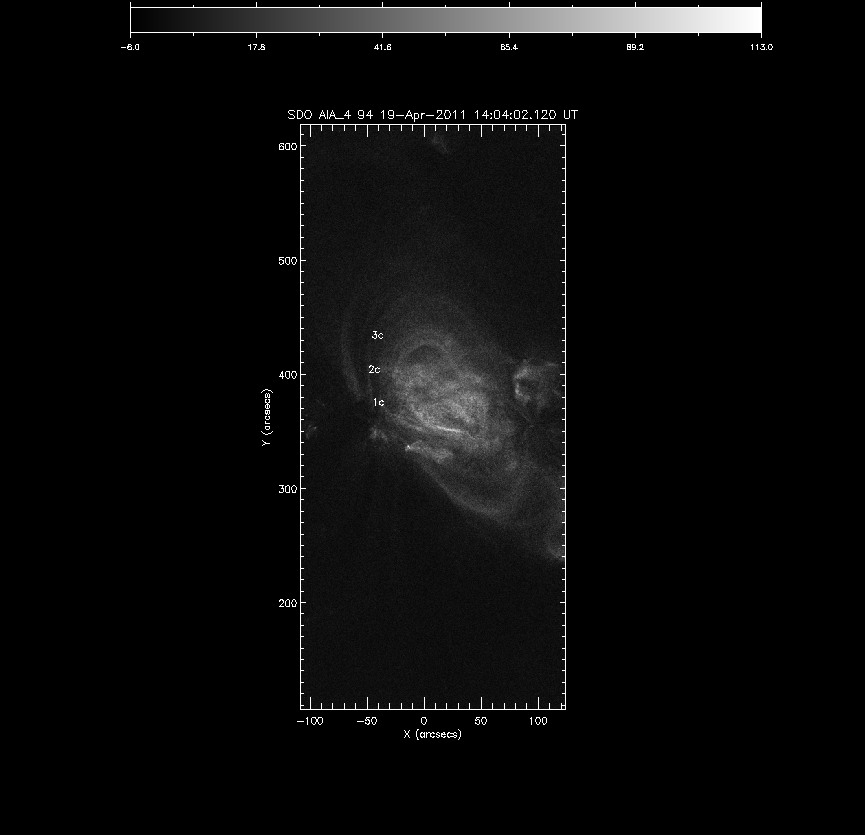 And here is the straightened loop with centre line in 193; 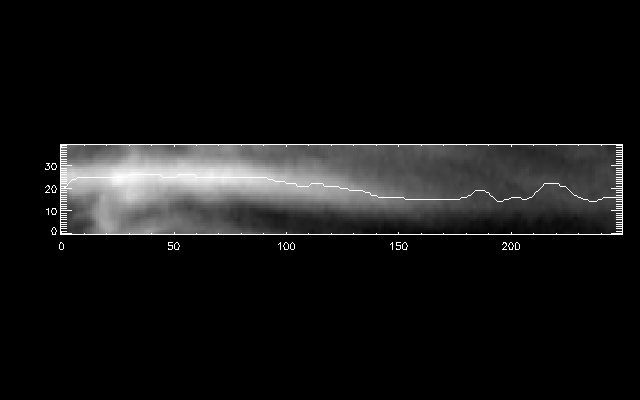 I also went through the AIA wavelengths and noted intensity values to allow Jason to try his DEM program. I chose a couple of points on the loop in one wavelength and noted the pixel postion and the intensities at that pixel, and then found the same pixel in all the other wavelengths (just by clicking until you find the right one) along with the corresponding intensities. We have also started working with densities. CHIANTI, an atomic database, has programs which allow you to choose a selection of ions and wavelengths and plots the ratio of their densities. Also, using fit_struc files we have started to plot density ratio images. Wednesday 27th July Recently we have identified another few loops in the active region from 19th April. This has meant some more coalignment due to the different times within the EIS raster. When coaligning an AIA image with a new EIS loop we had to rotate the AIA image, by just -0.25, and so when intercoaligning the AIAs I began to rotate them too. However they seemed to line up well without this rotation (so with just the x and y centres shifted) and actually were much less well aligned with the rotation. I realised that the roll angles on the original AIAs are actually slightly different to begin with, some are very close but for example, 193 has a roll angle of 0.135505 while in 131 it is -0.06348. So this complicated things. I also spend some time on a short program which calculated densities using EIS fit_struc files. The first method for doing this was to calculate intensity ratios between pairs of density sensitive wavelengths, compare to the CHIANTI database, find the nearest value to ours and return the density for that ratio; 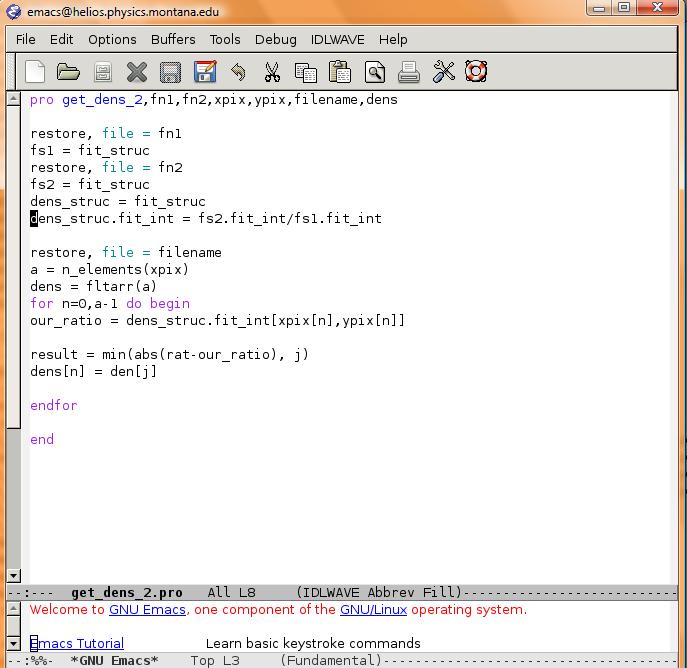 However, this seemed to just find and return the same values, so I changed to using emissivities instead; 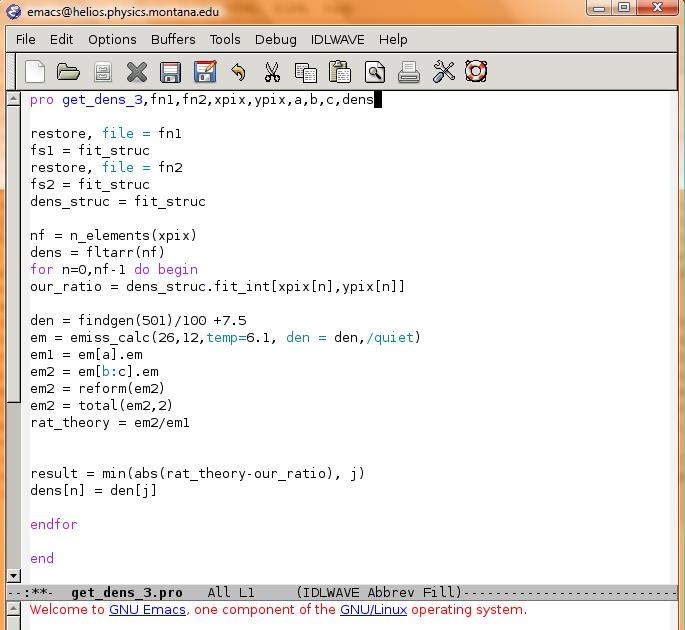 However we also had to do background subtraction before we could recover accurate densities, and Joe is working on a code for that. Friday 29th July The code that we are using to do background subtraction uses map files and we need intensity arrays from the fit_struc files, since these intensities are from fitting the spectrum which takes into account blended wavelengths rather than just totalling the window as in the regular EIS maps. So once the fit_struc intensities had been converted to maps we could carry out background subtraction. We have a program which uses picked points to extract and straighten our loop, and another to find the center at each pixel. From these we used this code; 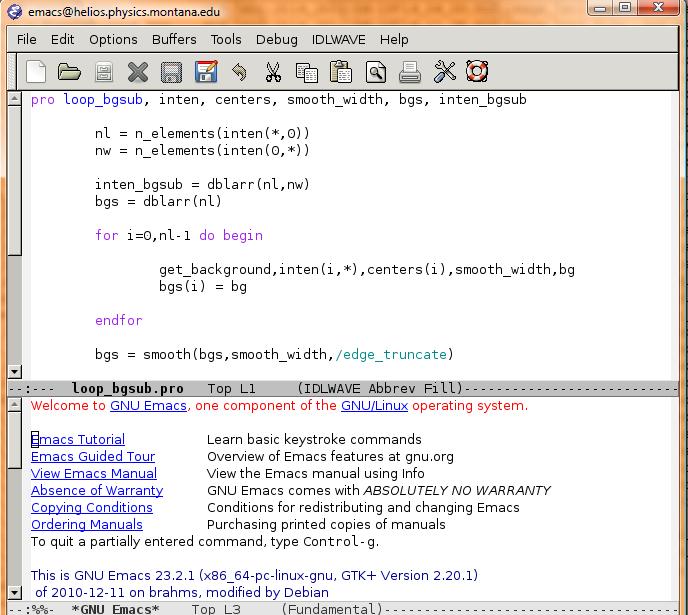 This works by subtracting the first quartile intensity value at each cross section of the loop. Here are the background subtracted images for some of the EIS density sensitive wavelengths; 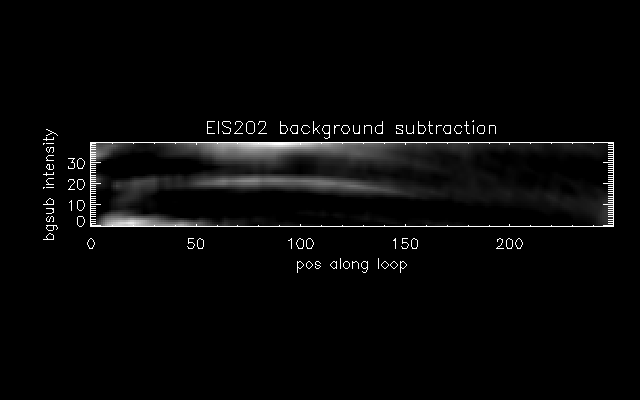 Apologies for the incorrect wavelength in the title, this is 186 but I haven't had the chance to re-do it. 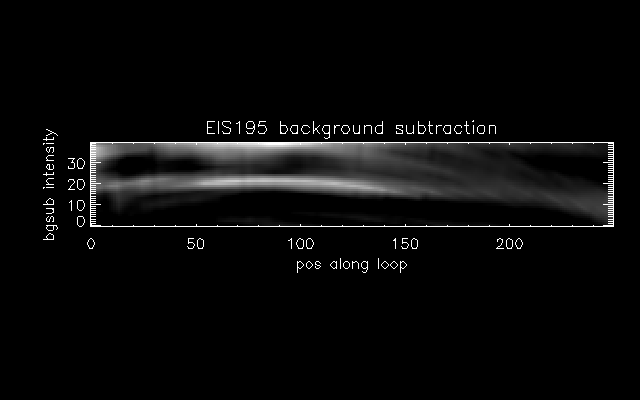 Compared to the previous unsubtracted images; 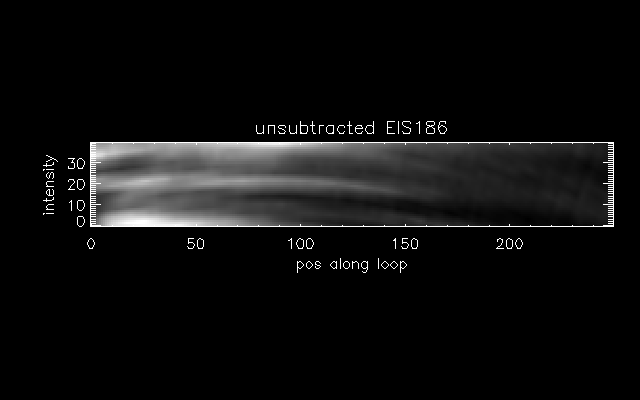 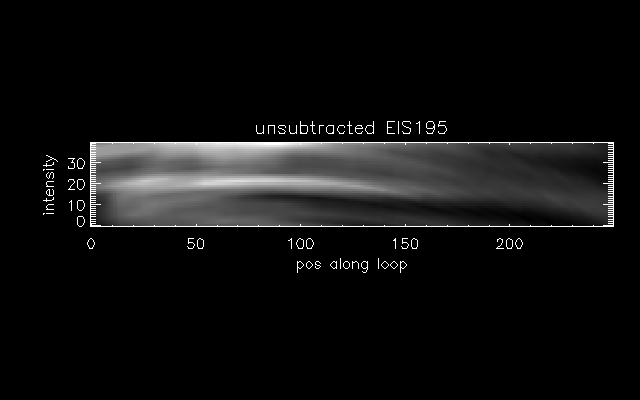 We now have background subtracted intensity ratios but are still working on getting the code to give us densities. |