|
Back Home >>
Research Log
Thursday 03 June 2010
Equipped with an assignment from my mentor, this morning I set to work on the IDL project needed for presentation tomorrow, which in my case will consist of acquiring GOES X-ray flux data on the flare of interest using the RD_GOES program, plotting the data, and fitting an exponential decay curve to it. A trivial task, it didn't take very long, though I did get stuck on the fitting part because I had pictured the math wrong. When I finished, I found that the exponential curve did not fit the data very well, especially in the region just after the flare peak. The best fit could be obtained with a period of about 1000 seconds after the start of the flare; though I could see a decrease in flux out to about 6000 seconds after the flare, a fit including this data made the match worse near the peak. The figure below shows the data with the fit overlain as a bold line.

Monday 07 June 2010
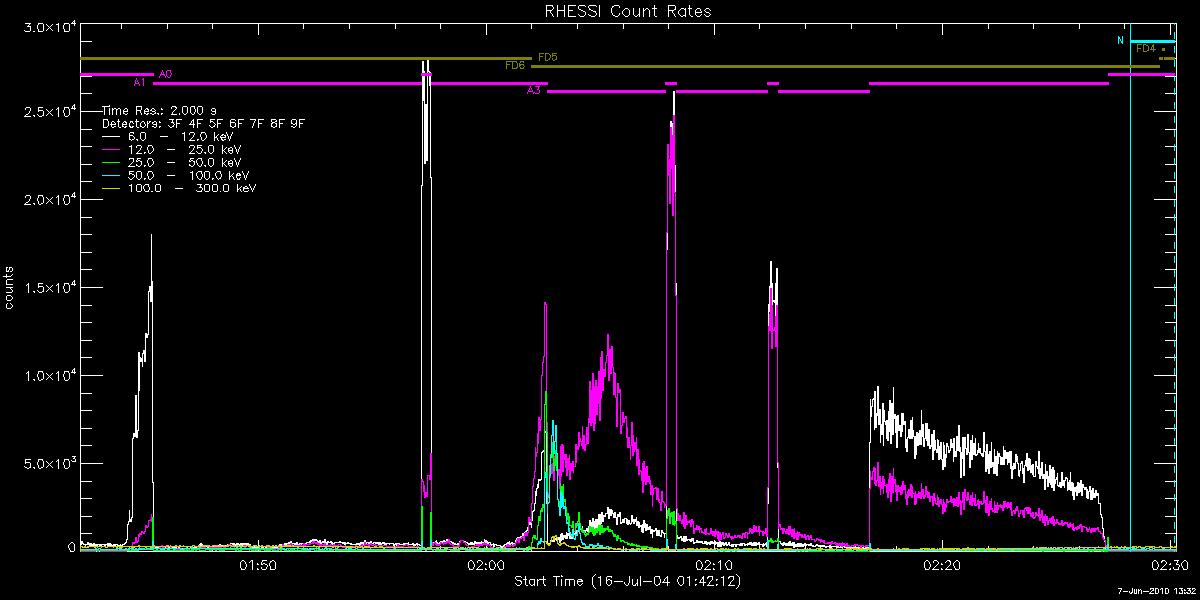
This morning I finished adapting the initial layout of these webpages from code I wrote for my personal website and published them. Although I tried to order TRACE data for my flare both Friday and today, I got no response; upon talking with Dr. Qiu I found that the TRACE server is having problems, but she will try to get the data for me. I played around with some of the RHESSI data using the tutorials Dr. Des Jardins gave, and produced a RHESSI lightcurve for the flare.

Tuesday 08 June 2010
I obtained the TRACE data; it turns out that the firewall on the LMSAL server was blocking their outgoing email that should have notified me of the data's preparation. After Dr. Qiu talked with the person overseeing the server, I was able to download the data by going to a page that showed the completed requests. My mentor is still out for a conference today, so I just played around with making RHESSI images and displaying TRACE data. My computer had several problems, so Keiji and Jeremy spent some time fixing those - this morning it couldn't connect to the nextwork because the Engineering department had blocked my computer, and yesterday Xwin was causing some problems, spontaneously typing a certain character into any text box I selected on a GUI from Helios. Keiji installed a different program, Cygwin, which fixed the problem and greatly improved the performance of GUIs.
Here is a movie of TRACE 171 Å data for the duration of the subject flare.
Wednesday 09 June 2010
As it would be useful to compare the RHESSI and GOES lightcurves, I set about to find a way to obtain the RHESSI lightcurve data - yesterday I used a GUI to extract the information from a FITS file and plot it, but in order to plot it along with the GOES I need simple arrays with time and intensity measurements. This proved to be time-consuming, as usual, but I accomplished it in the morning. I became sidetracked from the original goal of producing the two lightcurves and instead found the positions of all the attenuator changes in the RHESSI data - data in these intervals must be discarded.
Avoid all the following times:
| 01:45:20-24 | change A0 to A1 |
| 01:57:10 - 01:57:34 | check |
| 02:02:36-40 | change A1 to A3 |
| 02:07:54 - 02:08:18 | check |
| 02:12:20 - 02:12:46 | check |
| 02:16:46-50 | change A3 to A1 |
| 02:27:02-16 | change A1 to A0 |
In the afternoon Dr. Des Jardins showed how to make RHESSI spectra with OSPEX, and she plans to show more tomorrow. Besides learning how to do that, I also am working on the following tasks:
- Produce RHESSI images at several points across the flare in several standard energy bands to survey how the flare behaves in hard X-rays
- Plot the position of bright points in RHESSI images onto TRACE images to identify the origin of X-ray emission on the flare loops
Friday 11 June 2010
I finally produced a decent set of RHESSI images with which to survey the flare; an image every 5 minutes for the duration of the flare, about 01:40 to 02:30. I only produced a movie of 6-12 keV energy range because the other energy range I produced images for, 25-50 keV, resulted in nearly featureless images, whereas the 6-12 keV all show a dominant bright spotat the position of the flare. The 6-12 keV energy range is mostly thermal emission, while the 25-50 keV range is mostly nonthermal emission resulting from electrons colliding with dense material.Most recently I have been attempting to map the bright spot in RHESSI onto TRACE images, and although I have almost accomplished this, there are a few more kinks to be worked out.
Tuesday 15 June 2010
I have now finished mapping RHESSI contours onto the TRACE images for 6-12 keV; it turns out that the 25-50 keV images also show a bright spot, but I need to integrate longer. I have produced those RHESSI images and will overlay them onto TRACE as well tomorrow. Dr. Longcope spent some time comparing the magnetic pole positions with the TRACE loops and explained to me what was going on with the magnetic field structure. Much of today was spent trying to generate RHESSI spectra; though I now understand what settings to choose to produce these spectra, I have had problems with the software (it is running very slow) and so have not produced one yet, but should do so tomorrow.

Wednesday 16 June 2010
Expanding the TRACE/RHESSI overlays from yesterday, I produced RHESSI images at a higher cadence around the peak of the flare, every 20 seconds from 02:00 to 02:10, in 6-12, 25-50, and 50-100 keV energy bands; I produced the highest-energy band to include definite nonthermal emission. I have plotted these as contours onto the TRACE images, and they are almost ready for display. Also, I figured outa way to produce contours only at the peak intensity point in each image, i.e. where the flare is. With OSPEX I obtained a rough fit for a 20-second interval at the flare peak after running for about an hour; Angela helped me obtain slightly better fit by changing some parameters. At the high-energy end the fit is quite inaccurate because, Dr. Longcope says, I used uniform energy bins throughout, causing the high-energy bins to contain very few counts; thus I will need to reproduce the spectrum files used to do the fitting, which will take several hours tomorrow.
Monday 21 June 2010
The overlay of three different RHESSI energy bands onto TRACE has been completed and is displayed below; as the image shows, the position of the bright spots are indistinguishable between the energies. Unfortunately, as Dr. Longcope has found by examining magnetograms, this is because the loops emitting the flare are too small to resolve foot-points from loop-tops; thus we will need to find another flare to analze. I spent much of today writing code to find which flares (larger than M 5.0), during the times that RHESSI and TRACE were in orbit, are not associated with a CME, as that is one of the requirements for this study. Previously, Dr. Longcope had searched for X flares that meet the requirements for the study, and only this flare and another, which he has already studied, were found. Now I am looking at large M flares, and the list I have already selected will be narrowed by the availability of TRACE and RHESSI data.

Thursday 24 June 2010
Over the last several days, I have put a great deal of effort into accurately determining which flares during TRACE and RHESSI observing times were not associated with a CME. To do this, I used the LASCO CME catalog and GOES flare catalog and wrote a routine to find which flares do not have a CME within a half-hour before to a half-hour after the flare-time. At first I used the CME times given in the LASCO catalog, but we determined that those times were when the CME was sighted, not when the CME was emitted. I then used the quadratic, and if those were not available, linear,radial path fit parameters to extrapolate the onset time of the CME. Once this was done, and done correctly, I had a list of about 20 flares that met the qualifications: greater than M 5.0, no more than 45 degrees of longitude from sun-center, and no CMEs within a hour-long window centered on the flare onset time (following a paper on CMEless flares). However, most of these flares occured during RHESSI night or SAA interference times, and few of those that remained had appropriate TRACE EUV data. Not only that, but the hour-long window for excluding CMEs did not work in all cases, as sometimes very long flares would have a CME later than a half-hour from their start time, further narrowing the results. One flare remained with decent coverage from both satellites and of sufficient magnitude: an X 1.0 flare on 13-Aug-2004 at 18:07-18:15 (according to GOES), so we will begin to study that. I have already obtained TRACE and RHESSI data and have begun to make RHESSI images, and I hope to get a good deal of analysis that we have already done on the previous flare employed on the new selection. Through the search we did, we found that the paper we based the search on was not quite accurate in its designation of CMEless flares; in fact, the flare we were studying up to this point actually has a CME associated with it, though the CME does not come within the hour window around flare start.
Thursday 01 July 2010
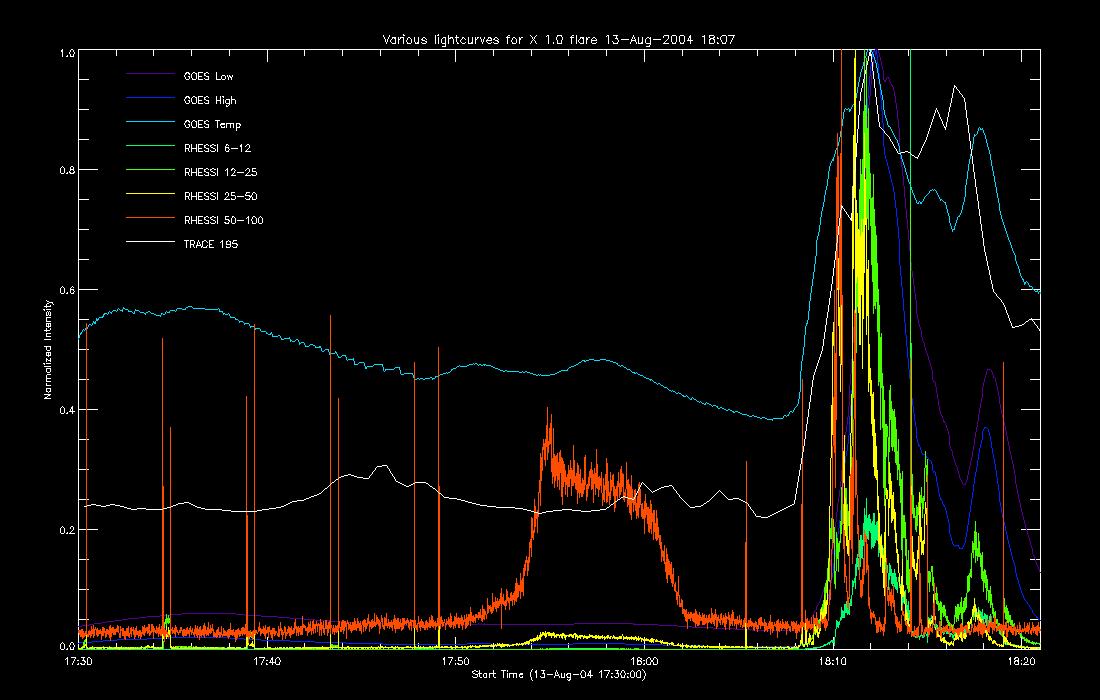
With a new flare selected, I have now obtained most of the data and begun the analysis, attempting to produce lightcurves, images, and spectra from RHESSI. Though I have not yet been able to obtain fully corrected RHESSI lightcurves, I produced a plot showing normalized lightcurves for GOES, RHESSI, and TRACE, as well as the GOES temperature (first plot below -- click on the image for more a larger version), to visualize when each band experiences its peak during the flare. All wavelengths appear to peak at the same time; however, there is a second peak in which the peaks are staggered, but I don't know what is happening there. The images have been a failure so far -- even with sufficient integration times and a field of view centered on the flare, all I get is noise. Angela is currently working on the problem, so hopefully that will be resolved soon. With spectra I have had better fortune, and restoration of a script into OSPEX, which plagued me on the previous flare, seems to work now. After selecting input and background, yesterday I fit the spectra of 20-second time intervals over the GOES flare-time, beginning with the time interval closest to the peak and feeding those results as initial parameters into each of the other intervals. I only used an energy range of 6-100 keV, which I think is why the fitting only took a few minutes for each interval, as opposed to about an hour previously. As the lightcurve shows, the RHESSI data has a large peak directly over the GOES duration (18:07 to 18:15), and beyond that there is very few counts; indeed, the spectra only produced acceptable fits up to about 18:08:40, while before that time the fit was entirely garbage. I am currently using the VTH thermal model, the THICK thick-target bremsstrahlung model, the DRM_MOD and PILEUP_MOD corrections, and models for two instrument spectral lines at approximately 8.5 and 10.5 keV; I am still adjusting the ways these models are being combined. Once we decide that I have obtained the best fit possible for one interval, I will again fit all the 20-second intervals and then observe how the parameters change over time. Below is an example of the spectra I have produced so far.


Tuesday 13 July 2010
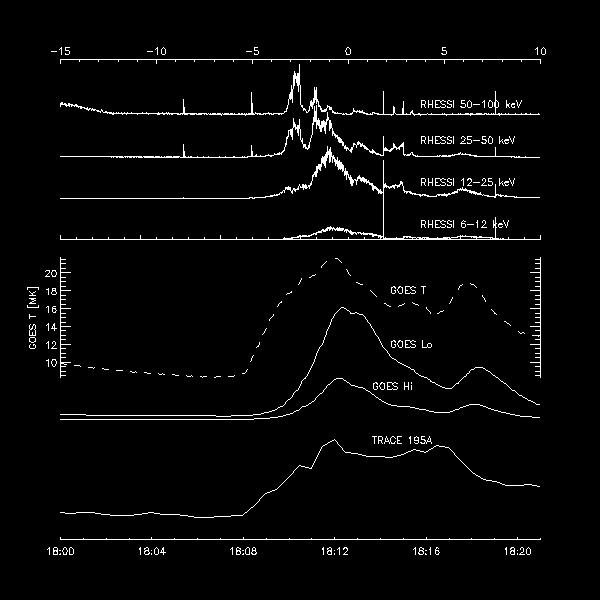
During the last week-and-a-half I have had great difficulties with the imaging and spectra programs, and that, combined with two days off for Independence Day and some sickness last weekend has resulted in little accomplishment; however, I am much closer to getting results. Angela was finally able to determine the imaging problem -- this flare is one of afew in the entire RHESSI flare catalog that has incorrect positioning information, and a change of the algorithum that the GUI uses to determine pointing fixed the problem, and I am now making images for 20-second intervals over the peaks in 35-100 keV emission (non-thermal) for 6-12, 12-25, and 35-100 keV energy bands, which should differentiate processes causing low thermal, high thermal, and non-thermal emission. The non-thermal peaks are used because they are manifestations of different reconnection events. I have finished fitting spectra for detector 3 using the model combination described in the last entry; I am currently working on detector 4 the same way, and once that is finished I will fit both detectors to two more models: with THICK with a single power-law instead of broken, and with two thermals instead of one thermal and THICK. The first will tell whether the non-thermal emission is better modeled by a single or broken power law, and while we know that the peak of the flare is dominated by non-thermal emission, not two thermal populations, the second will tell if there are two thermal populations before or after the flare.
I also spent a great deal of time producing a much improved light curve, patterned after the one in Dr. Longcope's original paper:

Friday 23 July 2010
I have finished the analysis for the project and am now working on telling the story of the research in my final presentation. I fit the spectra from both detectors 3 and 4 to the three spectral models mentioned the my last post: the broken power law, single power law, and two thermals. The broken power law clearly provides the best fit as evidenced by the chi-squared measures, and while there appears to be two distinct phases of the flare, a high-energy pulse from about 18:09:40 to 18:10:40 followed by a low-energy pulse from 18:10:40 to 18:12:40, as evidenced by the plot in the previous post, the low-energy emission seems to be entirely generated at the footpoints of the flare loops from plasma heated by the non-thermal electrons. This is also apparent from the RHESSI images, which show all the energy ranges coming from the same point. However, such a result is contrary to what Dr. Longcope expected; for in the flare he analyzed previously, there was no non-thermal emission, the spectrum was modeled by two thermal models. So I suppose we failed to find a flare that exhibits the same behavior; I was never convinced that there was no CME associated with this flare, because there is a CME that is extrapolated to have been emitted about a half-hour after the flare, but extrapolations can be wrong, and I suspect that the CME and flare were indeed complimentary, accounting for the predominant non-thermal emission.
|