Back to
flare list
FLARE 4, 21-APR-2002:
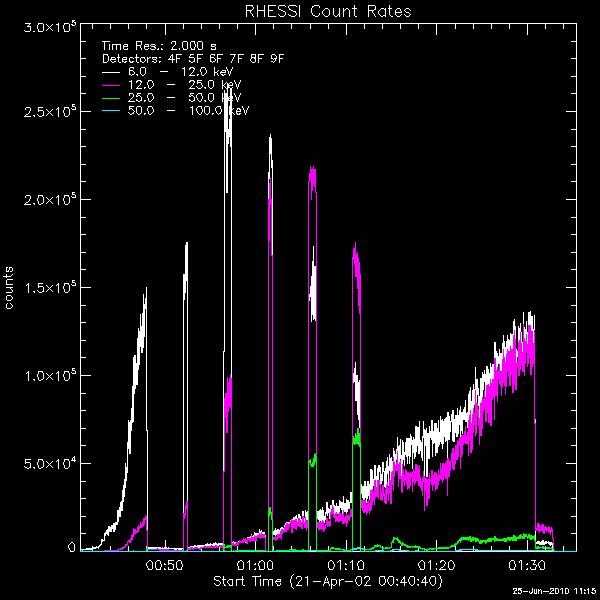 Lightcurve for flare 4
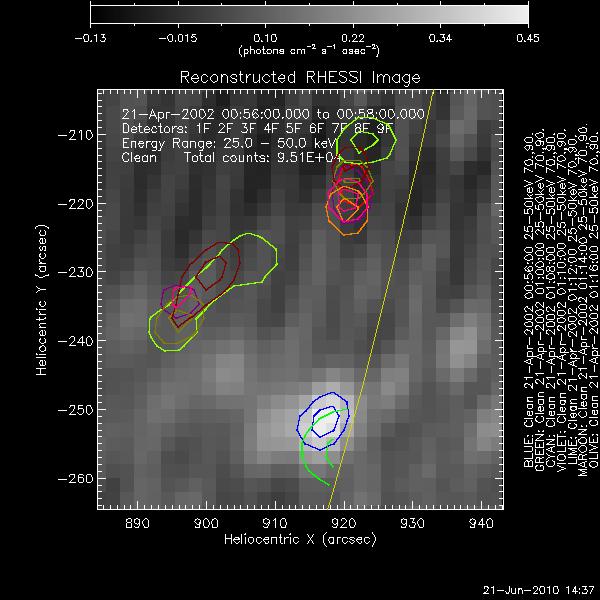 Early image of the "footpoints". Contains
thermal contamination.
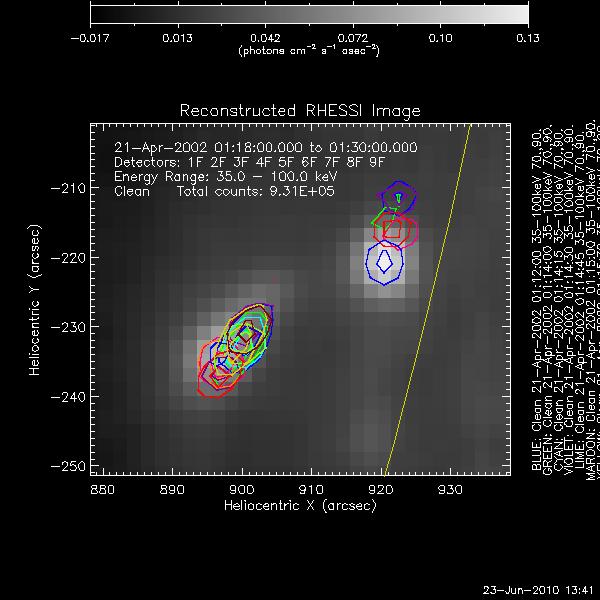 This
is the next image of flare 4 - the footpoints are really clean and easy
to discern here, as I imaged in the 35-100 keV range. I'm just going to
make one more image now of this with a 6-12 keV interval contoured on
top so that we can have a really clear idea of where the thermal part
of the flare is located relative to the nonthermal.
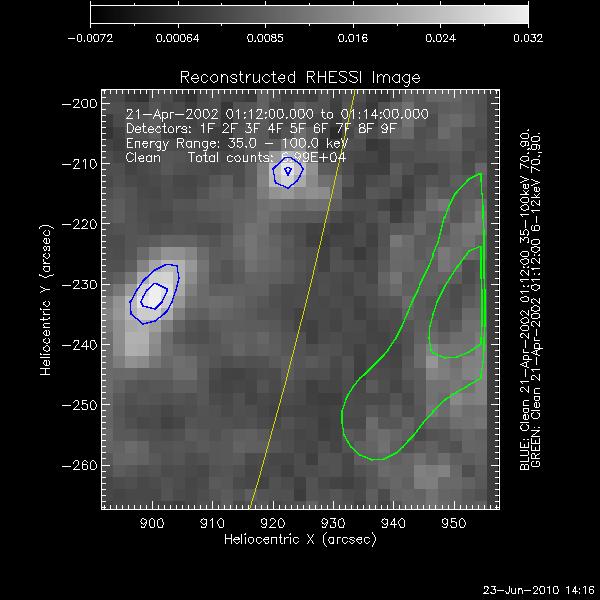 Ok, here I've contoured a 6-12 keV image
over a 35-100 keV one. Both are from the same interval -- 01:12:00 to
01:14:00 -- near the beginning of the flare (right after the last
attenuator interruption). This should be giving us a pretty clear
depiction of the structure of the flare - in terms of general footpoint
and top location.
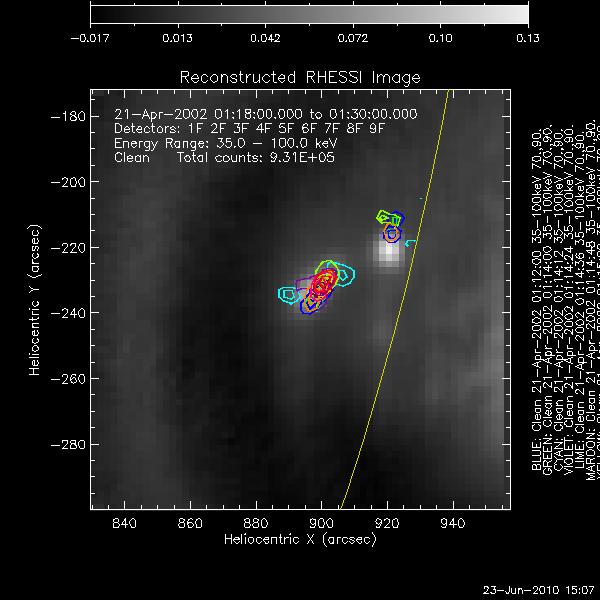
This is just
a redone version of the image at the top of today. There were too many
contours to include all of the later intervals, but I wanted to redo
the earlier, shorter ones and change them from 15 seconds to 12
seconds, as we get more reliable images if we use intervals that are
divisible by 4 seconds.
 Lightcurve for flare 4
 Lightcurve for flare 4
 Early image of the "footpoints". Contains
thermal contamination.
 This
is the next image of flare 4 - the footpoints are really clean and easy
to discern here, as I imaged in the 35-100 keV range. I'm just going to
make one more image now of this with a 6-12 keV interval contoured on
top so that we can have a really clear idea of where the thermal part
of the flare is located relative to the nonthermal.
 Ok, here I've contoured a 6-12 keV image
over a 35-100 keV one. Both are from the same interval -- 01:12:00 to
01:14:00 -- near the beginning of the flare (right after the last
attenuator interruption). This should be giving us a pretty clear
depiction of the structure of the flare - in terms of general footpoint
and top location.