IDL Assignment
This first project involved becoming familiar with using IDL to download and plot data as well as learning how to overlay different plots from different telescopes to gain insight about a particular solar event.
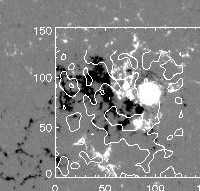
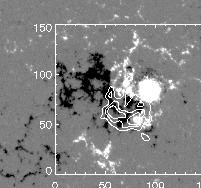
- With the coordinate information of the HXR image and the magnetogram for the May 13th, 2005 flare, which include the physical size of a pixel, the field of view and the center coordinates of the images, try to figure out how to coalign these two images. Contour the coaligned HXR image on top of the magnetogram.
The two images have the following properties:
HXR:
Pixel size: 2.00 arcsec/pixel
Center of image relative to Sun
XC = -176.580 arcsec YC = 239.840 arcsec
Magnetogram:
Pixel size: 1.98597 arcsec/pixel
Center of image relative to Sun
XC = -215.255 arcsec YC = 235.336 arcsec
The two images have different distances to the Sun and they also have different arcsec/pixel values. These values must be adjusted before the image can be plotted.
No levels shown
Levels: 30%, 50%, 70%
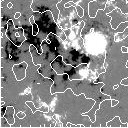
- There are two bright kernels in the HXR image. One represents a positive magnetic field and the other represents a negative magnetic field. In order to sum up the total brightness in each of the two kernels, the two plots need to be made to be the same size. This is done by simply cropping out the excess magnetogram from the overlaid plots shown above.
In order to sum up total brightness, simple where commands are used and the values can then be printed. The values for the counts that are more than 10%, 30%, or 50% of the maximum counts are given below:
10: pos = 3.30961 neg = 7.14028
30: pos = 2.01916 neg = 4.73939
50: pos = 1.35015 neg = 2.34165


