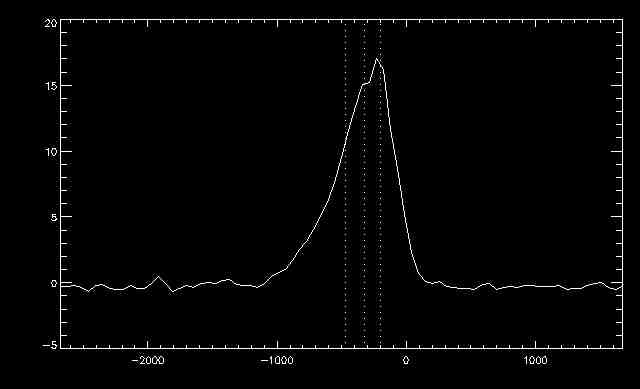
This week I started writing my own programs using IDL! My main objective was to take all of the data that I had processed in the previous weeks and visualize it in an accessible manner. I wrote a code to take each of the explosive events I had identified and plot their spectra. I then used Professor Kankelborg's code to plot the line quartiles on top of the spectra. The line quartiles may tell us how much certain explosive events are red-shifted and blue-shifted. Here is an example plot:

