Project Overview
- Analyze x-ray irradiance for full solar cycle
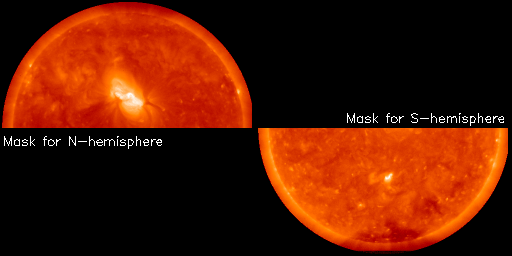
- Characterize dependence of the irradiance on solar latitudes
- Inspect irradiance dependence on specific solar structures
Hinode (Sunrise): A brief look
- Launched on 22 September 2006 from Uchinoura Space Center, last usage of M-V rocket
- Formerly Solar-B, the successor to Solar-A / Yohkoh (Sunlight)
- JAXA/NASA satellite mission
- Images in optical (SOT), extreme ultraviolet (EIS), and x-ray (XRT) bands
- Able to image longer x-ray wavelengths than SXT on Yohkoh
- Coronal temperature diagnostic ability
- Able to make temperature maps of coronal plasma from 1MK to more than 10MK
Hinode XRT Data Collection
- X-rays pass through pre-filter, reflect off of metal ring, and pass through two filter wheels
- Data collected by number of photons incident on charge coupled device
- Composite images of full sun are created twice per day
- Three exposure lengths
- Greater dynamic range of images and data
- Images not taken during ccd bakeout
- Three exposure lengths
Data Analysis
- Uses .fits files from XRT Synoptic Composite Image Archive at MSU
- Program
- Searches .fits file for XRT data with selected filter
- Bad data removed
- Datasets combined into one
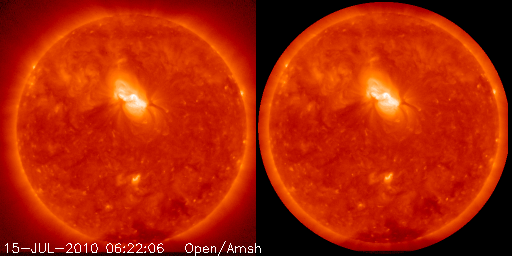
- A mask is created that sets outer data points to zero
- Image of sun centered in mask
- Analyzes data 1.1 solar radii from center of disc
- Videos and images are log scaled for intensity
- Plots date vs ccd count
- A Javascript movie can be made


Current Research
- Plotting and analyzing XRT data using aluminum mesh filter (filter 1 on filter wheel 2)
- Most used filter, most available data
- Greatest dynamic range of x-ray data
- Also compared with titanium poly filter
- Less dynamic range in low band x-rays
- Most used filter, most available data
- Working with 2010 data as this is before major ccd contamination
- I discovered that for most the year 2010, the irradiance is greatest in the northern hemisphere
- Video of Al_mesh full year 2010
In Conclusion
