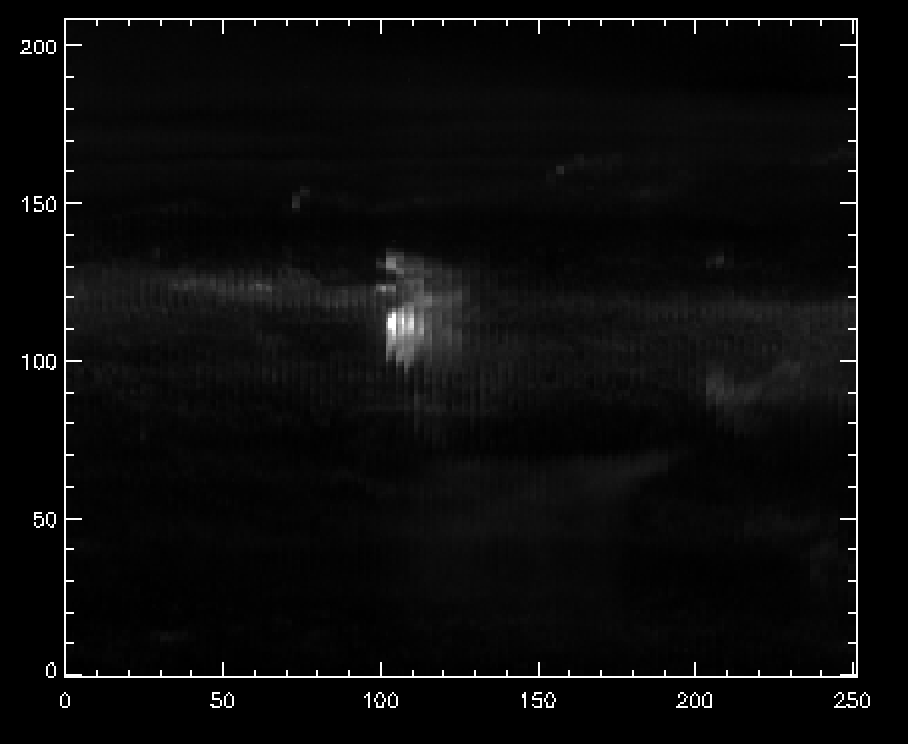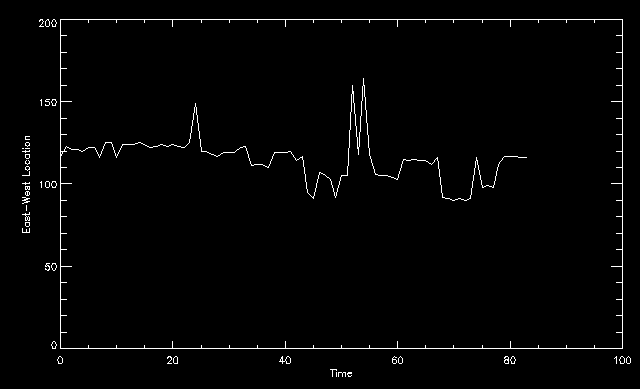
This week was a crash-course in learning IDL and the associated solar physics packages included in SSWIDL. Visualization was a major component of the tutorials, which was useful for later in the week when I worked on a mini-project to introduce me to the type of data processing I will be doing during my ten weeks at MSU. I learned to make graphs, images, and movies using IDL. Later in the week, Marika gave me the project to use structures to create a time-space stackplot as well as a time profile of the east-west location of the brightest pixel for each time step of the stackplot. Stackplots will also be created in later weeks for looking at coronal loops connecting an emerging active region and existing active region over time.

