Alpha Results
Mean Alpha
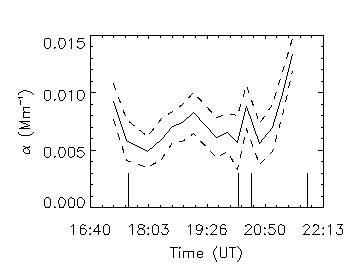
Mean alpha versus time is plotted with a solid line. Mean
alpha plus and minus the three sigma error of the alpha distribution is
plotted in dashed lines above and below mean alpha. The flare occurrences
are marked with vertical bars at the bottom of the plot. Alpha changes
significantly at the end.

Linear Fit Alpha
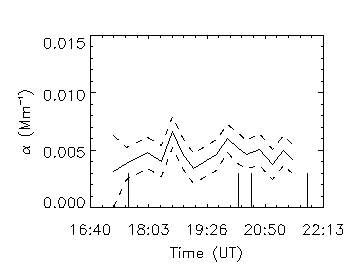
Alpha versus time for the linear fit is plotted with a solid
line. Alpha plus and minus the three sigma error of the linear fit is plotted
in dashed lines. The vertical bars mark flare occurrences. Alpha shows
little change.


