Influence of the field-of-view on the reconstructed magnetic configuration

Our first nonlinear force-free (nlff) reconstruction of active region 8210 (AR8210) was made for a field-of-view of 120"x120" (see Régnier, Amari, Canfield 2002, ESA-SP-505, p.65). But as we discussed during the last MURI meeting held in Berkeley, this restricted field-of-view is not adequate to understand the entire magnetic configuration of AR8210 (see Sterling et al. 2001, ApJ, 561, 1116): the field-of-view should be at least 3 times larger. We have done this

How is it useful? Does it change our idea on the mechanism of the flare?


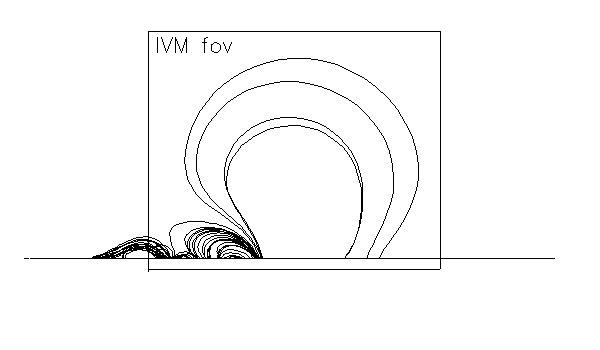
Comparison between the IVM fov and an extended fov

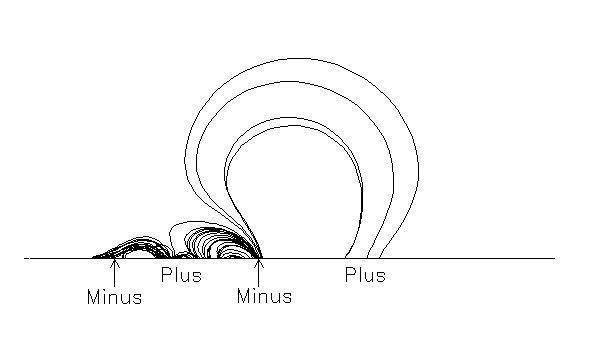
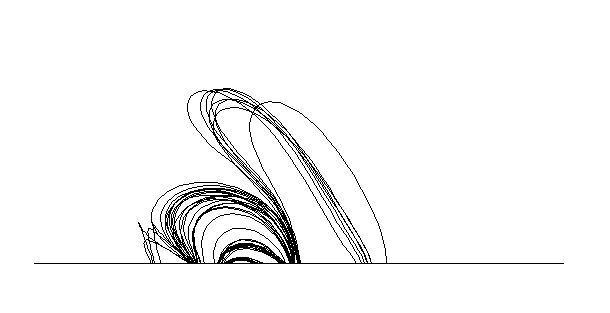
The smallest field-of-view is a restricted field-of-view defined by the IVM vector magnetograph. The largest one is the previous IVM field-of-view surrounding by MDI observations at almost the same time and re-calibrated with respect to IVM data (calibration of IVM is better than MDI). The magnetic field surrounding the active region is assumed to be potential. We note that the connectivity of the field lines are quite different. In the smallest field of view, field lines are influenced by the boundary conditions (B.n = 0).
"How is it useful to have a larger grid?": compare Figures 1 and 2 below. The connectivity domains, the height of the field lines are modified by the increase of the grid size. The magnetic configuration is therefore more realistic for the larger grid than for the smaller one.


Fig. 1 (click to enlarge): nlff reconstruction of AR8210 using the IVM field-of-view at 19:40 UT before a series of C-class flares
Fig. 2 (click to enlarge): IVM field-of-view surrounding by MDI data

Comparison between reconstructed field and cartoon

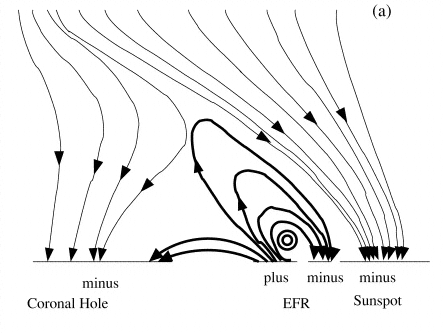
With the comparison given below of the Sterling cartoon (Fig. 4) and the reconstructed magnetic field (Fig. 3), we can see to good agreement between both magnetic configurations: the topology seems to be the same. We can notice that the reconstructed field has some restrictions the cartoonist has not:
- we impose a threshold on both the vertical and the horizontal magnetic field to take into account the noise level of the measurement. In the case of AR 8210 that means, we are not able to reconstructed field lines with a magnetic field on the photosphere that is weaker than our threshold;
- the boundary condition (B.n =0) which that a given field line cannot leave the computational box (no open field lines) does not allow us to determine the structure of the coronal hole;
- the filament or flux rope structure in the cartoon is not found in fig. 3 because the inversion line is very slender (~ 2 pixels) in the IVM magnetogram.
DOes it change our idea on the mechanism of the flare?": Not at all. The main difference is that the imagination of the cartoonist is confirmed by the reconstruction.
Fig. 3 (click to enlarge): Same as Fig. 2 with the same polarities as indicated in Fig. 4
Fig. 4 (click to enlarge): Sterling's cartoon for the M-class flare occuring in AR8210 at 22:40 UT
We now have plans to take into account the weak field or open field regions in the boundary conditions:
- to improve the computation we will use a non-uniform grid (a kind of pixon grid) in order to have no-zero grid cells on the photosphere;
- as the magnetic configuration is not so far from the potential field, we will compute the open magnetic field (B.n not equal to 0) in the potential field approximation.


MURI-MSU Nugget April 2003

Stéphane Régnier, Richard Canfield, Dana Longcope