 |
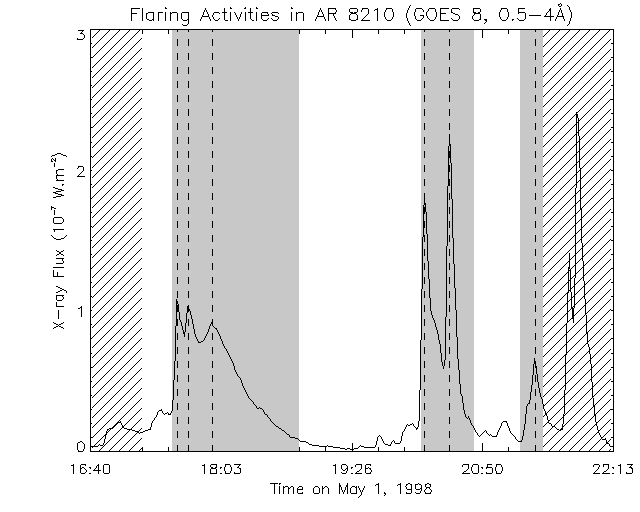
Fig. 3 (click to enlarge): X-ray flux from GOES-8 stellite in
the wavelength band 0.5-4 A. Gray areas show the flaring periods in AR 8210. |
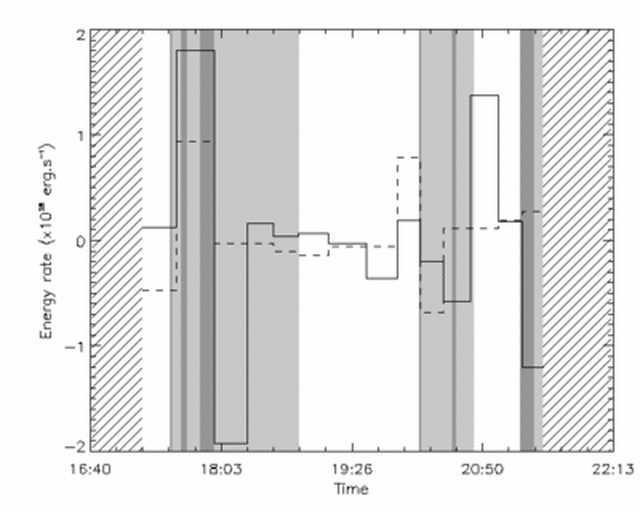 |
Fig. 4 (click to enlarge): Solid line: rate of change
of the free magnetic
energy (difference between nlff and potential
magnetic energy. Dashed line: Rate of input of energy into the corona
due to photospheric transverse motions, using the Mininum Energy Fit
(MEF) method (Longcope and Regnier, in prepration).
The dark and light gray areas refer to the rise and fall phases of the
flare X-ray emission.
Note two points: (1) the only times that the coronal energy is found to
decrease by a significant amount
are during flares. (2) The
only times that the coronal energy is found to increase is in the period
between 0 - 40 minutes before the flares.
|
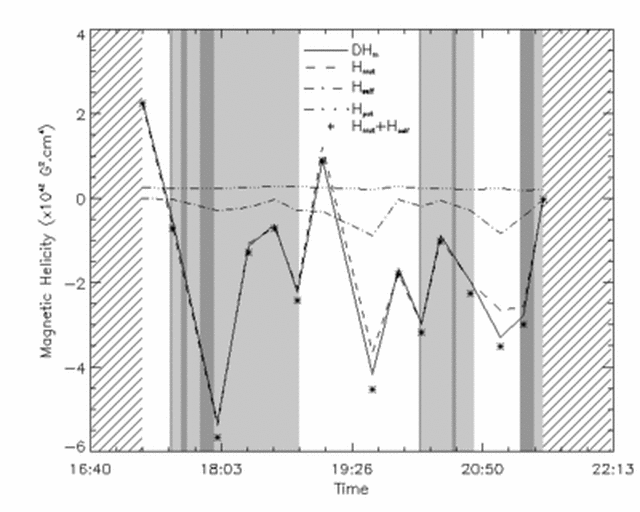 |
Fig. 5 (click to enlarge):
The time evolution of different
helicities (see Berger 1999): the self helicity of the closed field
(dotted-dashed line), the mutual helicity between closed field and
potential field (dashed line), the self helicity of the potential field
(dot-dot-dot-dashed line, nearly constant), and the relative magnetic
helicity computed directly from the Finn-Antonsen (85) formula (solid
line) and from the sum of the self and mutual helicity (stars).
Note that there is something going on with the self helicity
during the quiet period that we have to investigate.
|
