Science Nugget: Oct 24, 1997
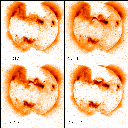
On 23-oct-97, SXT observed the formation of a coronal mass ejection (CME). Flaring loops associated with the event showed motion, and we saw strong coronal dimming in the volume surrounding the brightenings. The flaring loops are shown in the sequence of images below (four-panel box); the growth of the X-ray arcade can be traced during the interval 12:07 to 18:49 UT.

The coronal dimming is evident in the following difference image, an image formed by finding the difference in emission between temporally different but spatially similar events, which shows the formation of "transient coronal holes" to the northwest and southeast of the bright arcade. The contour shows the zero level in the difference, separating dark (the transient coronal holes) and bright (the arcade).
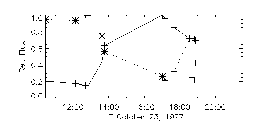
The coronal dimming can be seen more clearly by measuring the brightness
of selected regions and making light curves. An example is shown in the
following two images: On the right is an image of the arcade structure,
with boxes showing the selected regions of interest. On the left is a graph
showing the (normalized) light curves for those two selected regions. The
solid line in the graph traces the brightness of the large arcade; the
dotted line traces the brightness of the dimming region to the south.
 |
 |