
The HXT channels are 14-23 keV, 23-33 keV, 33-53 keV, 53-99 keV. Unlike
the X9 flare of 6-NOV-97, no serious saturation is seen in the HXT data.
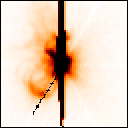
Next, time sequence SXT images are shown. These are half resolution
(2x2 summation, 5.2 arcmin FOV) images. The central part is substituted
by less severely saturated full resolution images Also, HXT L-band (14-23
keV) images are superimposed. As far as these SXT images are concerned,
ejections are seen in the southeast direction. Look at the image of 13:13:12.
Emission was already growing just to the left of the inset. It seems detached
from the bright area in the next frame, moving out of the FOV at 13:15:58,
leaving some loop structures behind. A similar pattern is seen again in
the last frame, but the direction is slightly different. (Click on the
picture to see a larger, more visible, version.)

A more complete view of the plasma ejection is given in a movie of 10.4 arcmin FOV images. The ejection first goes in the southeast direction, then turns to north east, probably following some field lines. Incidentally, the ejection seems to be repeated

(Click on the graph to see a larger, more visible, version.)
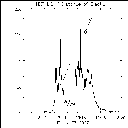
The resulting distance-vs-time plot is shown below, superposed on the
HXT M2 (33-53 keV) light curve on a linear scale. The zero reference for
distances is the brightest point in the post-impulsive phase, taken to
be the top of a compact loop or arcade. The slope corresponds to 330 km/sec;
sorry the distance scale is not shown (the Y axis is labeled with the HXT
count number).

(Click on the graph to see a larger, more visible, version.)
Further analysis of this and other flares continues.