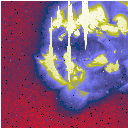
Yohkoh dares to offpoint!
Science Nugget: Jun 11, 1999
Introduction
As a part of joint observations led by scientist Jing Li of the University
of Hawaii, we "offpointed" Yohkoh to the southeast
(not "on axis", pointed at the center of the Sun, as usual)
in order to get a better view of
the streamers in that zone, simultaneously with UVCS, SUMER, CDS, TRACE,
and other telescopes. Why is this a big deal? Technically, it is difficult
because of our stray-light situation. However it is highly desirable because
the SXT (like most telescopes) works best on-axis. We now have enough confidence
in our stray-light compensation efforts to have conducted a joint observation
by this technique. From SXT's point of view, we would like to study the
run of temperature and density with height, under optimum observational
conditions. The analysis of faint, extended sources (e.g. streamers) is
the hardest possible kind of application of the data, but nevertheless
we dare to show you some of it here based on standard manipulations. This
can be done in an hour or so, whereas the real analysis will take somebody
much, much longer to get exactly right...
Here's how the offpoint program worked:
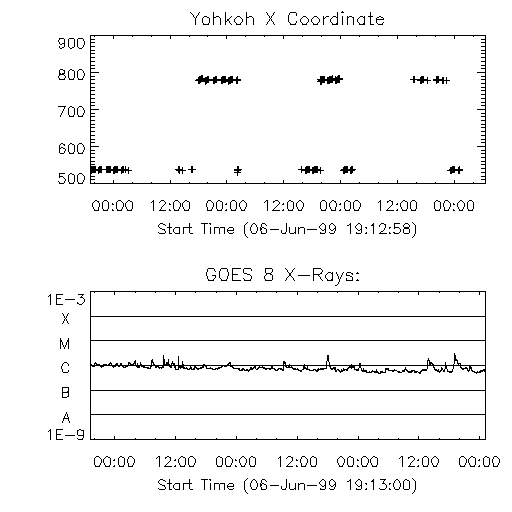
Here the upper trace shows the spacecraft X coordinate, in SXT pixel
units relative to an arbitrary zero (points near 500 are the normal pointing
postion), and the lower trace shows the GOES plot. No flares or major CMEs
to get in the way of our streamers, for better or for worse!
What do we see, and what does it correspond to at other wavelengths?
The three images below show (left to right)
One of our offpointed SXT images;
A Mauna Loa Solar Observatory (MLSO) K-coronameter image;
A Kitt Peak National Observatory (KPNO) He 10830 image
In this most convenient world, these images were simply copied from
the latest images
page at SDAC:
What we see on the SW limb of the Sun in the SXT image (left) is two nice
bulges corresponding to the bases of streamers. Ignore the bright spikes
from saturated active regions on the disk. The K-coronameter image shows
these streamers directly in scattered white light (apologies to MLSO, this
is certainly not one of their best images!); the He image shows that the
higher-latitude streamer (further south) actually corresponds to a rather
beautiful filament. It's seen dark on the disk here, and bright on the
limb. In the SXT data we sometimes see a hot
core in such a filament cavity.
So... we have collected excellent data on streamers.
Data analysis
Quick-and-dirty, of course; we have collected some of the images (the 30-sec
exposures in the SXT AlMg filter) by using a typical
IDL script and show a summed image below:

Here we're just showing the bottom half of a summed image composed from
frames spaced out over the interval 18:11:34 (June 7) to 02:02:26 UT (June
8), 210 sec total exposure. At the top, a routine square-root compression;
at the bottom, a view of the bottom 100 DN/pixel/sec range. Clearly there
is abundant signal here, and we hope that we can learn a great deal about
temperature and density variations. At the tip of the crosshairs the projected
height is 0.56 solar radii, or some 400,000 km.
Hugh Hudson, 11-Jun-99 (email hudson@isass0.solar.isas.ac.jp)


