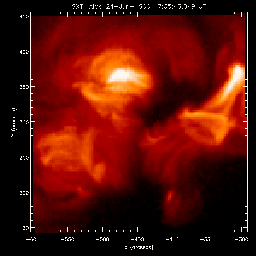
The experiment contains a spectrometer which allows scientists to examine radiation in the Extreme Ultraviolet (EUV) regime. These wavelengths are emitted by the Sun's hot corona at temperatures typically in the range of 1 to 3 million degrees. By making measurements at a large number of wavelengths between 300 and 355 Angstroms, information about the density, temperature, and plasma flows within individual coronal structures can be derived.
Yohkoh -SXT, TRACE, and CDS, EIT , and CELIAS/SEM onboard the SOHO spacecraft all coordinated their observations in support of the SERTS flight. In particular SERTS, SXT and TRACE focused on the same region on the Sun (N20 E30) in a string of active regions.
 |
 |
The TRACE image on the left shows many very thin and clearly delineated loops, which avoid the regions where there are more diffuse loops in the SXT image on the right. That can be explained by the fact that the plasma in the TRACE loops must be close to 1 million degrees Kelvin to be visible, while the plasma inside the SXT loops is much hotter, from 3 to 5 million degrees Kelvin. So in the two different pictures one is looking at quite different temperatures. The difference in loop temperatures is probably caused by different rates of heating along the loops -- the hotter loops are heated more strongly. What causes the TRACE loops to be so thin and so clearly marked, while the SXT loops are much fatter and fuzzier, is still an open question. It is partly just a question of resolution, since TRACE has 25 pixels for each individual SXT pixel. However, this is probably not the whole story.
If one interprets the thin loops in the TRACE image as very fine hairs, then, by analogy, much of the remainder of the image looks like hair that has been cut very short. That structure has been called ``moss" because of its lacy, textured appearance. In a string of recent papers (see below) it has been established with near certainty that moss is emission from the lower legs of the much hotter SXT loops. The two images above confirm that: the brightest moss is concentrated at the footpoints (ends) of the brightest SXT loops, as theory predicts.
The picture below is a TRACE image in the 195 Angstrom passband at about 1.5 million degrees Kelvin. The "moss" at this temperature is clearly less textured than that seen in the cooler 171 Angstrom line, but the intensity distribution of the moss is nearly identical, again as theory would predict. So I end with the same conclusion as last week: that simultanous measurements at different wavelengths are a prerequisite for putting together the global picture.
June 27, 1999: Piet Martens
(martens@isass0.solar.isas.ac.jp)