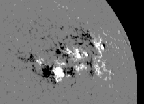
 This is a magnetogram of our chosen target AR complex. The region deemed
`most likely to flare', called AR 8731, is the very large, strong bipole
(black-white pair) in lower left of the complex
(jargon: TRACE = Transition Region and Coronal Explorer, SoHO = Solar and Heliospheric Observatory, GBO = Ground-Based Observatories, JOP = Joint Observing Program)
 This is a magnetogram of our chosen target AR complex. The region deemed
`most likely to flare', called AR 8731, is the very large, strong bipole
(black-white pair) in lower left of the complex
white = positive field (pointing away from the solar surface),
black = negative field (pointing towards the solar surface)
NOAA had predicted that AR 8731 might give an M-class flare. However, even though we are rapidly approaching solar maximum, and we expect that the flaring activity should be building to a peak, there have been remarkably few good flares this year (see the nugget on 6-Aug-99 for more on this). So we were a little anxious.
A summary of the data so far can be found on the Max Millenium web site here. But to whet your appetite, by clicking on the thumbnails below you can see some SXT and TRACE movies.
Half-resolution SXT movie
TRACE movie in the 195A
showing the formation of
filter, showing filament
post flare arcade, plus
lift-off, small brightenings
some ejected material.
- looks very different from the
This images plasma at about
SXT movie. The bright material
3-5 million Kelvin
is at about 1.5 million Kelvin
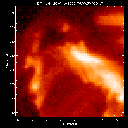
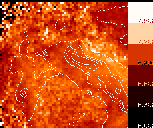
The left-hand image below is a Full-resolution SXT frame from 06:00:36 UT, during the rise phase of the flare. It faintly shows the arcade, primarily displaying the bright footpoints. In the right-hand image the intensity measured from the first image is overlaid onto a map of the temperatures in the region (actually the log of the temperature, linked below). The structures which are brightest in the SXT intensity image (contours in the overlay) appear to be cooler than some of their surroundings. Some but not all of this is due to instrumental effects (like scattering of photons within the telescope, which has not been corrected in the making of this temperature map); therefore the reader is cautioned not to believe any of the log-temperatures higher than 7.2. But notice in particular the interesting appearance of a temperature gradient in the small loop on the left-hand side of the frame (plotted at coordinates x=600, y=200 in the intensity image).

|

with intensity contours |
Now go back and look at the TRACE movie again -- that loop doesn't appear in the TRACE data until 15 minutes later. In fact, several of the structures which are visible in the SXT images can't be seen in the TRACE data, and vice versa. Is this a sign that the loop starts hot and then cools until it is visible in TRACE images? If so, then how quickly is it cooling? And is the loop heated impulsively just once at the beginning of the flare, or is it heated continuously for several minutes? These are only a few of the questions we hope to address. Stay tuned!
Lyndsay Fletcher <fletcher@sag.lmsal.com>
David McKenzie <mckenzie@physics.montana.edu>
October 22, 1999