That is why we sometimes study eruptive phenomena away from the limb (or close to disk center). Some of these eruptions are observed as `halo' CMEs with SoHO/LASCO, because of large angular extents up to the whole circumference. There is a great service of compiling and maintaining a list of LASCO halo CMEs by the LASCO team (thank you, Simon Plunkett and Chris St. Cyr). These events are important not only for geo-effectiveness and space weather but for understanding magnetic structures responsible for CMEs in general.
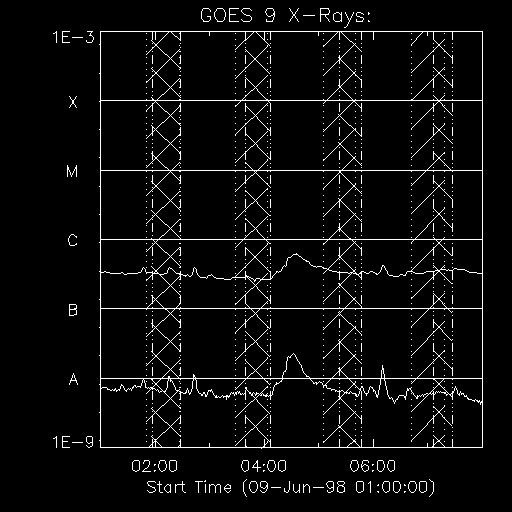
One of the events included in the LASCO halo CME list was well observed by SXT. The GOES light curves for a period that encompasses the CME are shown below (click to enlarge) with usual hatch marks showing Yohkon night (from upper right to lower left) and SAA (from upper left to lower right). There was a small flare around 04:30 UT.

The following movie (click the thumbnail) shows the lower half of SXT full-disk images at times indicated on the GOES light curves. The bright region, a nice sigmoid, produced the small flare around 04:30 UT. We also see expanding loops from the northwest end of this region (AR 8232), later assuming a cusp heading to the direction of 2 o'clock. But it was the eruption of a long structure (probably a filament) to the southwest of the region that seemed to be more directly connected with the CME. The rising motion of the filament seems to have already started at the onset of the flare.

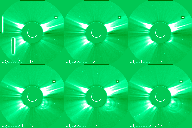
The following figure (click to enlarge) shows the LASCO C2 data. They are taken from a movie available in the above LASCO halo CME site and it is possible that faint structures (such as the halo) are not well represented. But these frames show that the brightest part of the CME is in the west to southwest (the direction of 4 o'clock or 4:30).
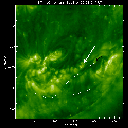
The event was observed by EIT in the 195 Å channel. The movie is available below (click the thumbnail). The movie shows similar eruptions as the SXT movie. But the EIT data also shows the filament channel from which the filament took off.

To the southeast of the sigmoid region, closer to the limb (the direction of 7 o'clock), we see turbulent motions of dark features. The SXT movie also shows the counterpart in soft X-rays indicative of dynamic processes. This may well be a filament eruption, but the EIT movie (when played slowly) suggests that the material fell down again. So this may not be an eruption that results from cutting overlying field lines. Indeed the footpoint brightenings seem to be negligible.
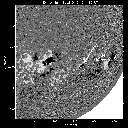
In the following we compare the EIT, MDI and SXT data for the larger scale
eruption than the active region. In the EIT image (left panel), we traced
elongated dark areas that may be filament channels. They correspond to
magnetic inversion lines in the middle panel (MDI magnetogram).
'A' (the white arrow in the other frames) shows emerging flux, which grew
rapidly in a short time. 'B' (the black arrow in the other frames)
is a cancelling feature as found in a MDI movie (cadence
every 96 minutes). The right panel shows the corresponding SXT
image, where the filament was already displaced from one of
the channels. The filament, as seen in SXT images, has structures
as are H filaments.
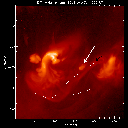
To summarize, the CME was temporally associated with a small flare, but the eruption of material from a filament channel seems to have been more directly connected to the CME. The filament channel, or the zone of magnetic field inversion, was affected by emerging and cancelling fluxes.
We do not say that this type of CME is everything. We are fully aware that some CMEs probably originate from active regions without larger-scale filament eruptions. But distinction of the possibly different types of CMEs in coronagraph data has not been extensively documented.
24 December 1999
N. V. Nitta (nitta@lmsal.com) in apprenticeship with Jingxiu Wang