As you may know, Yohkoh has four instruments on board. One of these is the Bragg Crystal Spectrometer (BCS) experiment, which observes X-ray emission lines from four highly-ionized elements: Fe XXVI, Fe XXV, Ca XIX and S XV. Here the Roman numerals denote the ionization state, with FeXXVI having only one electron (hydrogen-like). The S XV, Ca XIX, Fe XXV and Fe XXVI channels all observe plasma diagnostics during solar flares, while the S XV also observes active regions outside of flaring intervals. Normally these observations are not so spectacular (no images!) so we seldom mention them in the weekly science nuggets, even though the spectroscopic information is quite valuable for studying flare physics quantitatively.
The observation described below took advantage of rare Yohkoh motions to scan the spectra away from their nominal positions, as described below.
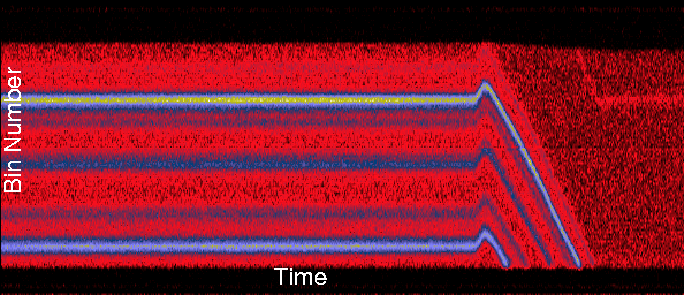
Yohkoh observed the Crab Nebula during its transit near the Sun on June 14, as described in next week's science nugget. To observe the Crab Nebula the Yohkoh pointing direction had to swing 1.2 degrees south of Sun center. The lines seen by BCS depend on the angle of incidence of the radiation, according to the Bragg condition, so this means that the four BCS spectral bands sweep into uncharted domains. Since the BCS observed during the actual offpoint maneuver, it was possible to watch the shift in wavelength of the lines seen by the BCS as the satellite swung slowly around. The figure below illustrates this by showing a plot of intensity with bin number along the detector (corresponding to wavelength) and time. Increasing bin number and wavelength is downwards. The brightest feature is the "w" line of S XV at about 5.04 Angstroms. These features first move slightly to lower bin numbers resulting from a small preliminary pointing change (switching sensors on Yohkoh), and then shift continuously to larger bin numbers corresponding to pointing southwards - Crab territory. As the bright w line moves off the detector we see another line appearing at low bin numbers. We will discuss this feature further below.

We've also prepared these data in javascript movie format, taking advantage of 3-second accumulations of counts in the S XV channel spectrum. (Please be patient and let all the frames load, then the movie displays the frames). On the light-curve plot we also show a red line, indicating the times for which we show the spectra plotted above the light curve. As the red line moves along the light curve plot, we see subsequent spectra in the S XV channel detector. The movie illustrates some of the effects already noted in the plot above.
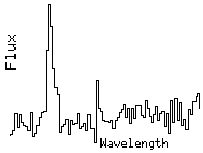
We were quite surprised to see an emission line at the new rest position in the S XV band. It is not readily seen in the 3-sec accumulations for the movie, so we have integrated longer to get the spectrum shown below (click to enlarge):

This is the result of accumulating the data after the offpoint for 213 seconds. This shows a clear line. By accumulating the data for different periods of time it was possible for us to accumulate enough counts to just detect the line and yet also have an adequate time cadence between subsequent spectra in order to measure the relative wavelength difference between features. In this way we are able to estimate the wavelength difference between the S XV w line at 5.04 Angstroms and the line which appears after the offpoint. We find that they are about 0.095 Angstroms apart. This thus yields a wavelength of the line of about 4.95 Angstroms. From Mewe et al., we identify the line as Si XIV and Si XIII.
15 June 2000
Khan, Handy, Hudson