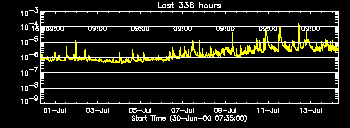
The last several weeks have been, well, disappointing shall we say, from the standpoint of flaring activity during the heights of Solar Maximum. Looking back to two weeks ago, things were pretty flat line...a few flares, but nothing really like the Solar Flare-zilla we've been looking for. Then as a new active region complex began rotating onto the disk, things really started clicking as we went from sub-C baseline GOES level to mid-C level, with numerous lengthy excursions into M-class:

This week, we've had three X-class flares, all rom NOAA AR#9077. There have been 15 M-class flares or better from a variety of sources, according to the GOES event logs:
11-JUL-00  12:12 13:10 13:35  X1.2 2N N18E27 9077
12-JUL-00  10:18 10:37 10:46  X1.9 2B N17E27 9077
14-JUL-00  10:03 10:24 10:43  X5.7 2B N17E01 9077  <-- biggest flare yet, in this ccycle!
showing the event times and magnitudes. It is astonishing to note that the development of this region into a "super-region" was actually predicted on July 9. The "X" classification is a shorthand for the logarithm of the peak X-ray flux and is the biggest listing. X10 would correspond to 1 erg/cm2sec, roughly a millionth of the total solar energy flux, in soft X-rays alone.
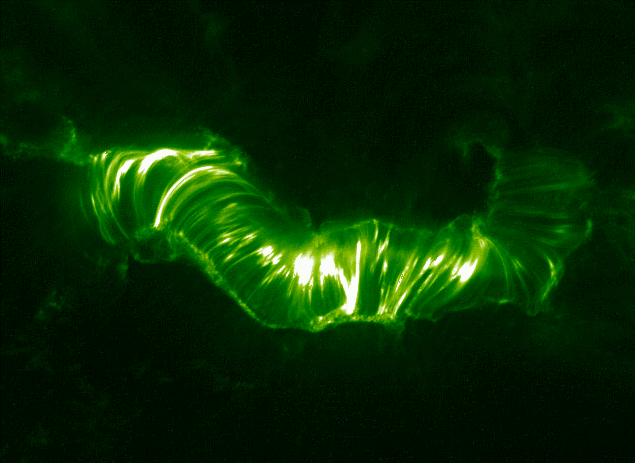
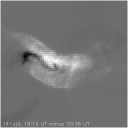
Although the ramp-up of activity started on July 4, appropriate for a fireworks display, in fact the main event thus far took place on July 14 - Bastille Day, also OK for fireworks if you are French. We are working now on Guy Fawkes Day (Nov. 5). In fact another memorable flare had already occurred on Bastille Day, 1998, leading to extensive theorizing and pontification. The two images below show TRACE and SXT images of the remarkable arcade structure that developed:

|

|
Here the TRACE image on the left is from near flare maximum (11:00 UT) and has a width of 230,000 km; the SXT difference image on the right compares the times shown and has about the same width. The SXT difference images clearly shows the dark hole left by the disappearance of the sigmoid structure, lying under the arcade still quite visible some ten hours after the event. In this case the sigmoid active-region structure must have followed the basic pattern and erupted into a coronal mass ejection, leaving the arcade in its place; we don't really understand sigmoid behavior that well, however, as an earlier science nugget illustrates.
In the spirit of never looking at a solar image and understanding it perfectly - the obvious unanswered question regarding such an arcade, especially emphasized by the TRACE image above on the left: how in the world can the footpoints of the arcade have such a clearly-organized pattern whose scale greatly exceeds the known scales of the largest convective scales known in the photosphere? Why doesn't the convective overturn erase any such large-scale structure?
Another dumb question, but we have to ask them. Click please on the innocuous-looking GOES plot above, and then note the dotted lines showing: lower, something roughly parallel to the exponential growth of solar soft X-ray background flux during this interval and upper: a much faster increase for the flare peak fluxes. Why is this?