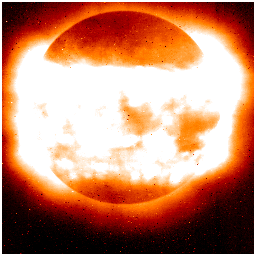
This week we've had a sunspot group at an extreme southerly latitude, as shown in the synoptic view below, made by just adding many of our daily images over the past week:

The brightest soft X-ray emission shows the location of sunspot groups, roughly, and the tonsure-like upper part of this sum image shows the presence of sunspots in the northern hemisphere, with a rather sharp northerly limit. But in the South, there is emission from about -40 degrees latitude. It has an intermittent appearance simply because this figure does not contain full data coverage. This region is #9127 in NOAA's sequential (chronological) numbering scheme. Click here for a clearer view of the region itself, as seen in soft X-rays, of course.
Every now and then one sees something a little unusual in otherwise routine data, and one asks self-indulgently - "how unusual is this?" So this science nugget answers the question - "is this southerly spot group setting any records?".
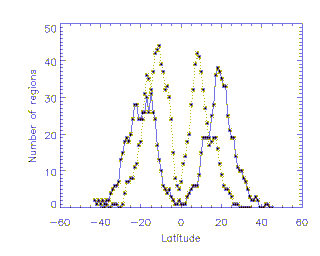
Thanks to our professional SolarSoft tools, we can look quickly into this question. First, one can just look at the total distribution of sunspots with latitude. The plot below breaks up the decade of the 1990's into two halves - the old 11-year cycle (1991-1996), and the new cycle (1996-present). The break point for this was September 1, 1996, actually; check out the helioexalepidoptery science nugget for more detail. So, we find the two distributions superposed below:

where the old cycle shows up at low latitudes (the dotted line), and the new cycle at higher latitudes (the solid line). This is a representation of Spoerer's Law, discovered in the 19th century following the discovery of systematic patterns (e.g., the sunspot cycle) in sunspot occurrence. One can see from the plots that, roughly speaking, 40 degrees is about the limit for sunspots to form, but that in fact there are a few near that limit.
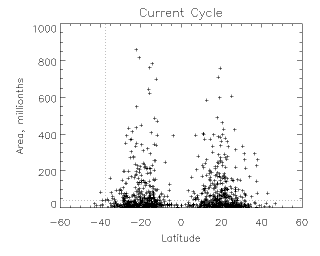
Well, so it's not record-setting from that point of view. But maybe it is the most southerly largest region ever? We are always hoping for a breakthrough. Hence the plot below:

which compares the sunspot areas with their latitudes for the current (1996-present) cycle. The dotted lines show NOAA #9127. Alas, there are larger and more southerly regions to be found, even within recent history. As one would expect, the further one goes from the most common latitudes, the smaller the regions become - one would expect this selection effect from the null hypothesis that the intrinsic distribution of spot areas does not depend upon latitude at all.
Apparently sunspot groups have appeared at latitudes as extreme as 70 degrees, so really we haven't even come close to a great discovery here. But it is still interesting - NOAA #9127 is almost the most southerly largest sunspot group of this cycle! The theory of solar magnetism (the source of spots) apparently is not robust enough to predict the pattern of sunspot occurrence, so for the time being we can simply relax and enjoy the complicated patterns of solar magnetism.
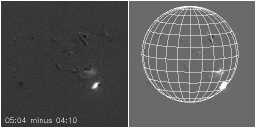
Sure enough, just as we thought we'd finished writing this, the region had an eruptive flare:

Which of course Yohkoh missed because of orbit night, and everybody missed, because we are engaged in dedicated observations of NOAA #9125! The two plots above are a compressed difference image (left) and a direct image (right) with heliographic grid at 15-degree intervals. A close look will show the dark dimming region around the bright flare (left image), the result of the ejection.
Additionally, the region kept growing in area, right through its limb passage. The mean area during its life through August 19 was 78 millionths, making it possibly the largest-and-most-southerly active region thus far this cycle, at least.
Have you detected jargon in this nugget?
For instant relief try
Dr. Strous's astrononomy glossary or
Space Environment Center Glossary of Solar-Terrestrial terms.
August 11, 2000