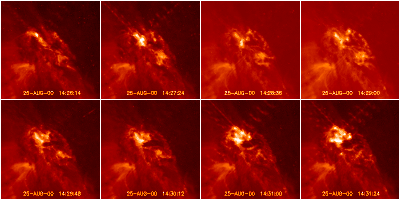
In perhaps one of the biggest duds of the current solar cycle, Max Millenium Observing Plan No. 10 began just as the Sun more or less turned off - activity was so weak that we cancelled the program halfway through. But, then a small miracle happened - just at the last gasp, a well-observed ejective flare with oscillations did occur. A gee-whiz look at the oscillations appears on TRACE "picture of the day" site. We've made a standard hard/soft X-ray plot to show the timing of the flare emissions.
In addition to the TRACE oscillations, we were fortunate to observe this event in a new SXT observing mode with wider field of view and greater sensitivity for ejecta than we've previously used. Sure enough, it was interesting, and the third section of this science nugget tells why we think so.
This flare (but perhaps they all should) reminds us of a "knotty flare" reported in an earlier science nugget. It's got structures too compact even for the 0.5-arcsec pixels of TRACE to resolve:

The images above were taken at 16-sec exposures in the 171-A bandpass, which shows coronal temperatures. These long exposures probably smear out some of the tiny features shown in the plots below:
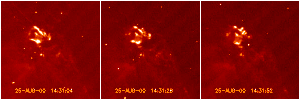
which display images at 1-sec exposure time. We speculate that these brief, bright kernels of emission correspond to the footpoints of individual skinny coronal magnetic loops that guide high-energy electrons down into the chromosphere. Hints of this have come from timing analyses, but not yet directly from images. In these images a few cosmic-ray hits have left dot-like blemishes. These can usually be distinguished from real kernel-type solar emission, since they do not persist from image to image.
Finally, the plot below shows TRACE chromospheric images, somewhat overexposed, in the UV continuum. These also are consistent with knotty footpoint brightening according to the pattern we expect.
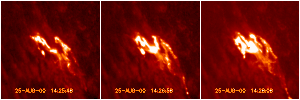
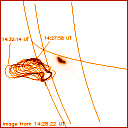
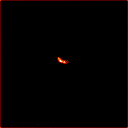
The TRACE movies show a puff-like ejection of material from the flare core (this requires a movie of difference images, which we don't have available right now). However SXT sees the ejection quite well. This implies an elevated temperature, and the fact that TRACE also saw it probably implies a broadly multi-thermal structure. The plots below show two Yohkoh images - on the left, a deep SXT image with contours outlining the time development of the puff-like ejection (each contour from a succeeding image at 16-sec intervals); on the right, a properly exposed soft X-ray image with hard X-ray contours superposed. The point of the latter is to show the extremely compact and energetic origins of the event, and to emphasize how hard it is for us to see the dramatic range of flare phenomena in one glimpse.
|
|
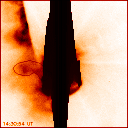
Below is one of the highly saturated "deep" images that we use to study the coronal effects. This is the first public view of a new mode of SXT use that (we hope) will allow us to see global coronal waves more efficiently than in the past. The image is 5 arc min across, and the huge dark blemishes in the middle result from (deliberate) overexposure. The contour line shows a rough estimate of the shape of the "puff" ejection, useful for comparison of temperature and emission measure with the radio observations.
And now one of the nicer things about this event. The Zurich radio group's "Phoenix" spectrometer caught the "drifting type IV decimetric event" event shown below (courtesy of Pascal St. Hilaire) - probably the first event of this type to be well-observed both at decimeter waves and soft X-rays.
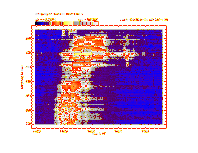
In this plot one sees the radio spectrum evolve with time, with the emission drifting rapidly from high to low frequencies. This implies that the source moves from high to low densities, ie upwards, just as we simultaneously observe our "puff" ejection to move outwards from the solar surface. The Type II burst (a radio signature of a global coronal wave) alas started at 14:35 according to the tabulations, and SXT did not see any TRACE of it. We hope to have better luck next time, but in the meanwhile we can certainly analyze the structure that we did see.
Because the radio observations explicitly determine the density of the source, if (as believed) the emission occurs at the plasma frequency, we can eliminate some of the ambiguity in interpreting the X-ray observations. For example, we could constrain the elusive "filling factor" about which much argumentative heat gets dissipated. A first look suggests that the X-ray and radio data are mutually consistent with reasonable temperatures (a few million K) and with large filling factor (ie, near unity). We're working on it.
The hastily-done discussion above does not even touch on the main discovery in this event, the oscillating loops resulting from the flare - these were after all the objective of the miraculously successful observing program. No doubt the ejection puff stimulated these oscillations, of which only a few other examples exist. Once the coronal magnetic structures oscillate, then the oscillation frequencies determine otherwise un-knowable properties of the corona, which we understand very well in some ways, but very poorly in others.
Have you detected jargon in this nugget?
For instant relief try the
glossary at the Space Environment Center or
Dr. Strous's astrononomy glossary.
September 1, 2000