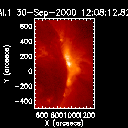
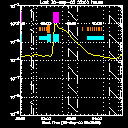


The GOES plot, above right, shows the time variation of the soft X-ray flux. The purple band near the top shows when SXT was in flare mode, the sparse set of orange lines just below that show the times of the full-frame images, and the blue lines that are packed tightly together show the times of the partial frame images. Yohkoh got great data coverage during the later impulsive phase of the flare, but for reasons not yet apparent to the author we have a gap in the data right before flare mode kicked in. It is possible, but unlikely, we'll be able to fill in this gap.

So, we have an event that spurred the GOES X-ray flux to X1.2 and a ghostly ejection to the southwest. Did the Yohkoh hard X-ray telescope see anything?
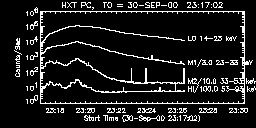
The answer is yes: HXT has lots of counts in all channels:
Efforts to make quality movies of the HXT data have proven difficult for reasons not yet clear to this novice HXT user. However, we did succeed in collecting nice images near the beginning of the flare. This three figures below show soft X-ray images (SXT thick Al) with contours of the HXT imagery from the beginning of the flare. From left to right, this shows the HXT LO, M1, and M2 channels (thermal, intermediate, and highly nonthermal X-rays). The SXT image used here clearly shows the blob of material that is ejected to the southwest.
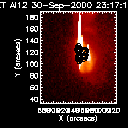
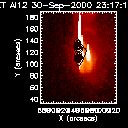
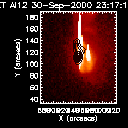
The bright blob of material ejected during the impulsive phase near the beginning of this event is sufficiently active as to appear in several of the HXT channels (though this is probably not well-demonstrated by the figures shown here). The questions raised by this nugget might include: what happened to the ejecta? How did this event manage an X1.2 rating? Why don't we see it in the quarter-resolution images? What happens between the end of our FOV, and the beginning of the LASCO C2 coronagraph, where it never (according to our untrained eyes) appears?
October 6, 2000
Brian Handy <handy@isass0.solar.isas.ac.jp>