This nugget is pretty technical - we've therefore added a simple synopsis for those wishing a quick overview.
At the end of a previous nugget, it was reported that Yohkoh observed several intense flares during 24-26 November 2000. The unusually high flare activity ended with the X4 flare that started at 16:40 UT on the 26th. This week, we summarize what we saw during the special period, now that all the data are in place.
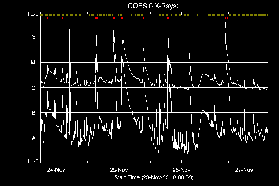
The following plot (click to enlarge) shows the GOES soft X-ray light curves in the 1-8 Å (upper) and 0.5-4 Å channels. All the X-class flares and most M-class flares were from AR 9236 (whose central meridian passage was on 24 November), and none of their light curves indicate long duration events (LDEs). The M-class flare around 01 UT on 25 November occurred in another region (AR 9240) to the east, and its variations were more gradual. The colored tick marks on top of the plot show SXT data coverage. The red ones indicate flare-mode images. So the first X-class flare (around 05 UT on 24 November) was not observed in the Yohkoh flare mode -- but we saw nice dimmings in SXT full-disk images taken before and after the flare as shown in the previous nugget.

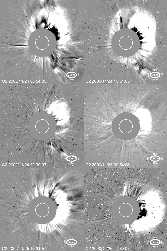
LASCO C2 data show halo CMEs (coronal mass ejections) slightly after all the X- and M-class flares from AR 9236. The LASCO representative running difference images from six of them (including all the five X-class flares) are shown below. The brightest part of the CME moved southward with time, especially in the last two events.
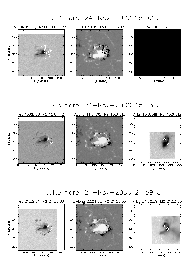
Close-up views of the same six flares are shown below, split into two figures. For each flare, a white-light image (either from TRACE or MDI), line-of-sight magnetogram (from MDI) and soft X-ray image (from SXT) are shown from left to right. On each a hard X-ray image (from HXT) is overplotted as contour maps. The SXT images are in reverse color. The time differences of the white-light images and magnetograms from the flare times are corrected for.
 |
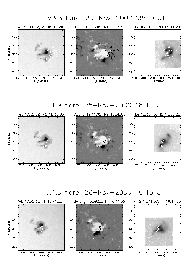 |
For the first flare not observed by Yohkoh, the contours are for a TRACE UV 1600 Å image, which may include emission from loop foot-points as do hard X-ray images. TRACE is in an eclipse season between early November and early February 2001, and its sequence consists mostly of 1600 Å images with occasional white-light images. The TRACE white-light images for the second (and possibly the third) flare indicates that it is a white-light flare. See the leftmost image in the second flare for bright features below the HXT contours. We have to be a little careful here, since the TRACE "white-light" channel is also sensitive to UV continuum, but the intensity of the second flare is so high that it should really be a white-light flare. We note that the flares up to the fourth one came from the western part of the spot with positive polarity (white on magnetograms), and that the last two came from more south. This southward shift of the flaring region, and the change in the tilt of the hard X-ray foot-points (from the direction of 10 o'clock to 2 o'clock), may have resulted in the similar shift of the brightest part of the CME. Of course, more comprehensive 3-d pictures of how a CME leaves the low corona to be visible with a coronagraph may have to await STEREO, but these data are indicative of the importance of small-scale magnetic field to destabilize large-scale field. Anyway, we can say that the flares up to the fourth one were homologous, and that the reason for such a quick recovery of the same bipolar structure was probably new magnetic flux from below the photosphere.
Around the sunspot, a high level of magnetic flux emergence was recorded by MDI during the period of high flare activity. A movie of MDI longitudinal (line-of-sight) magnetograms for AR 9236 is shown below (click the thumbnail), with a pointer to the GOES light curves which may facilitate a comparison of flux emergence and flare activity. The field of view is larger than the previous figures to include the following plage region (in black, i.e., of negative polarity). Compared with the preceding sunspot with dynamic flux emergence which ended on the 26th, the following plage region was quite eventless even though its maximum field strength amounted to 700 G or so. We note that the area south of the preceding spot became more dynamic, resulting in a spot in negative polarity, as the area to the west became quieter.

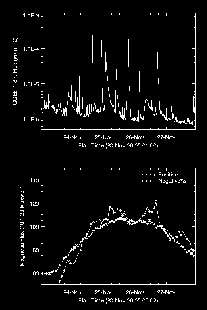
For those people who think that the dynamic changes in the MDI movie were actually because of magnetic flux scraping off the main spot, such as moving magnetic features (MMF), not representing new magnetic flux, the following plot shows the time variation of the total flux around the spot. The pixels whose magnetic field strength are between 100 G and 1000 G are summed up. This is done separately for the positive and negative polarities. No correction is made for projection effect, which is not very severe even in the last frame. The plot shows that the magnetic flux indeed increased during the high flare activity. The variations in the negative polarity flux in particular have some fine structures that may appear to correspond to some of the flares.
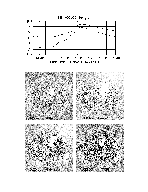
One of the most reliable indirect signatures of CMEs in the low corona is dimming in the EUV wavelengths. An example of the EIT dimming is shown below. The figure shows difference images with a pre-flare image subtracted. The upper part of the figure shows the GOES light curves for this event with five vertical lines corresponding to the times of the images including the pre-flare image (14:44:39). We note dimmings for the first time in the second frame, northwest and southeast of the flaring region. This corrends to a time slightly before the soft X-ray peak. With the 12 minute cadence of EIT, we can say that the dimming started in the impulsive phase of the flare. This timing and spatial pattern seem to be applicable also to the remaining five events. But for the rest of this nugget, we discuss this flare (24 November 2000, 15 UT).
We are always curious about how a CME would look like when it starts. Can we see the ejected material of a coronal mass ejection? As we have discussed before in these nuggets, over-exposed, large field-of-view SXT images may have a hint. A movie of such images (in reverse color) is given below (click the thumbnail). The vertical spike represents saturation. In the upper part, the HXT H-channel as well as GOES light curves are shown to compare the timings of ejecta with the mpulsive phase. We clearly see an ejection exactly at the impulsive phase and an additional one later. We do not claim that these are the CME itself, but they may surely give the CME an extra kick, and that may be why these flare-associated CMEs started fast followed by deceleration.

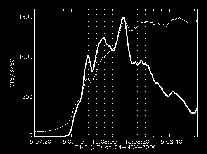
Speaking about the impulsive phase characterized by hard X-ray emission, we see something interesting around the hard X-ray peak time. The following plot shows HXT L-channel (14-23 keV) and H-channel (53-93 keV, in thick line) light curves for the period of interest.
The H-channel images corresponding to the 12 5-sec intervals are shown below. They give an impression that foot-points slowly rotating counterclockwise. Does this mean energization of different loops?
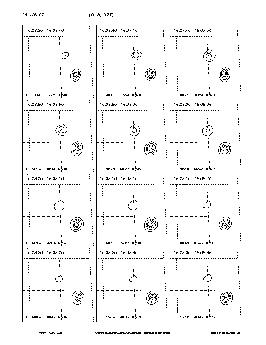
For the first and last intervals, the HXT images are overplotted on TRACE 1600 Å images. The bright areas in the TRACE 1600 Å images seem to correspond to the hard X-ray foot-point sources. It appears that the separation of foot-point sources increases as the rotation takes place. If the rotation is toward a less sheared configuration, the standard eruptive flare scenario applied here. But we need more analysis to confirm this. Note that the 1600 Å images also show other features, anything around 0.1 MK (corresponding to C IV emission) and at lower temperatures (from the UV continuum).
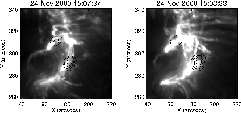
Finally the TRACE 1600 Å movie. The images are sampled at every 6-10 seconds, although the original cadence was as good as 1 sec. We see dynamic motions of the loop-like structure even before the impulsive phase. This is probably part of an eruptive filament system at temperature 0.1 MK. Like some of the soft X-ray ejecta, this UV feature may be very important for understanding the CME initiation. In short, the UV images show much more complicated structures than do hard X-ray images, where the sources are typically concentrated at two areas (the foot-points of a loop). It is unfortunate that no TRACE 1600 Å images after the time of the last one are available for this flare.

Here, we would like to know if the two hard X-ray sources really mean the foot-prints of a special loop structure. Is it possible the simple appearance of the hard X-ray images is due to the limited dynamic range of the instrument? These questions may be partly answered by HESSI. See site 1, site 2, site 3 - why should there be three homepages? Once again, TRACE 1600 Å images show flares (including loop footpoints) with better temporal and spatial resolutions than has been achieved with hard X-ray imaging. They are and will be complementary to HXT and HESSI, which will provide more quantitative information on nonthermal electrons.
22 December, 2000