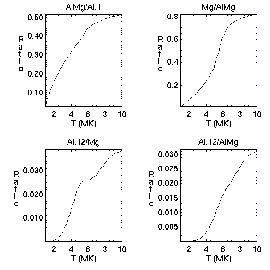
In order to understand how the solar corona is heated, the distribution of temperature along a closed loop is essential information. Data from X-ray and EUV imagers are widely used to derive the spatially resolved temperature. Speaking of SXT, the so-called filter ratio technique leads to "color" temperatures. You take the ratio of two images in different filters (with slightly different temperature sensitivities), and the ratio directly gives you a temperature. See the plots below (click to enlarge).

The plots generally show monotonic curves with temperature, meaning that there is a one-to-one correspondence between the ratio and temperature. The underlying assumption, of course, is that a given pixel, area or line of sight is occupied with one-temperature plasma. But is the solar corona so simple as to justify this assumption? During this week, there was a SOHO campaign (JOP 137) to study dynamics of active region loops. Although Yohkoh was not invited, we took some ancillary data for the same active region (AR 9357) that we hope will be useful for characterizing the real corona.
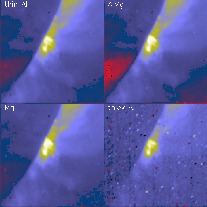
AR 9357 was a small active region. It was seen on the south-west limb on 1 March 2001. The following figure (click to enlarge) compares images as taken by SXT (thin Al or Al.1), EIT (284 Å) and TRACE (171 Å). The temperatures of plasma in these images are typically >2 MK, 2 MK, and 1 MK, respectively. One may trace basic common structures, but the region appears quite different in these images.

This has been known for many years. For example, images in Fe emission lines (red and green) from ground reveal quite different loops from those seen in SXT images, as nicely shown in this article. One caution to those who analyze SXT images to study temperature of the corona is that the temperature sensitivity in each filter is broad and that except for the thickest filter (Be) the sensitivity ranges of the filters largely overlap with one another. As a result images in different filters look quite similar. See the following figure.

We took data in four filters to model the temperature of the loops in a more realistic manner than accepting the temperature from one filter ratio (as usually done). The need for this is obvious. A given line of sight can intersect plasma of different temperatures, i.e., a structure like a loop should not be an isolated 2-d object lying in the plane of the sky. This is seen by comparing two filter ratio temperatures for a given area. For a small area as indicated in the above figure (lower left panel), we get 2.3 MK from the AlMg/Al.1 filter ratio, but 4.5 MK from the Al.12/Mg ratio.
A first step beyond the one-temperature assumption is a two-temperature model. Of course, this is still too simple, given that we can do morphological studies in much more detail, but as an astrophysical approach it may not be too bad. Two-temperature modeling has been made, for example, to X-ray observations of solar-type stars. In solar research, two temperatures have been assumed to interpret SXT and EIT data. But the problem was that there were only three measurements, which were not enough to determine the four parameters (temperature and emission measure of the hot and cool components). An interesting thing about the EIT two-temperature results is that the hot component could be ~2.8 MK, which should affect SXT images.
Then how do our four-filter measurements improve the situation? I did quick math to get the four parameters for the small area as shown above, but within the time that can be used for a nugget, it was not possible to get them. More specifically, the Powell minimization has not so far given me reasonable numbers. One possible reason may be that the sensitivities of two of the filters are too close, effectively not providing independent measurements. Moreover, there are other caveats in SXT temperature analysis, e.g., our earlier nugget. But, after spending enough time, we will hopefully come up with reasonable temperature distributions for observations tht involve a different set of filters. It would be possible to identify in SXT data a component as cool as 1.5 MK. Then we will be ready to do a joint analysis with SOHO (CDS in particular, because of its intrinsically better diagnostic capability.)
3 March 2001