This nugget takes a peek at the data from the X-class flare of August 25, 2001, as summarized in the NOAA event description , which reveals this to have had a huge radio flux at short wavelengths. Here is a chance for us to write a nugget showing how all parts of the solar spectrum do things simultaneously, in a complicated broadband manner, in such an event. In particular we provide snapshots at wavelengths near one millimeter, 400 nanometer, and 100 femtometer wavelengths (popularly called mm-waves, optical radiation, and gamma rays). Better check us on that last wavelength, since gamma-ray astronomers almost never speak in these terms!
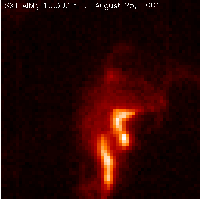
We'll comment on radiation mechanisms below, but first let's look at what SXT saw: in a baleful color table, here is what the most interesting moment looked like:

Radiation mechanisms
The flare radiations, including the soft X-ray emission seen in the image, appear superposed on the normal solar spectrum. This is predominantly a blackbody spectrum defined by the effective temperature of the photosphere. As the plot below shows, this spectrum (labeled "quiet Sun") peaks in the visible range. To the left (long wavelengths; low frequencies) we have the radio domain; to the right (short wavelengths; high frequencies) we have the X-ray and gamma-ray domain. This sort of plot is amazingly ambitious, because it purports to display vast ranges of the parameters: 14 decades on the abscissa, as many as 19 on the ordinate!
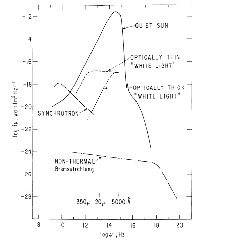
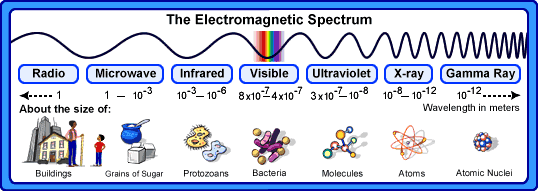
The emission mechanisms shown in the plot include blackbody radiation, gyrosynchrotron radiation, and bremsstrahlung, but not the nuclear mechanisms involved in the gamma-radiation. For simplified explanations, click on the cartoon below:
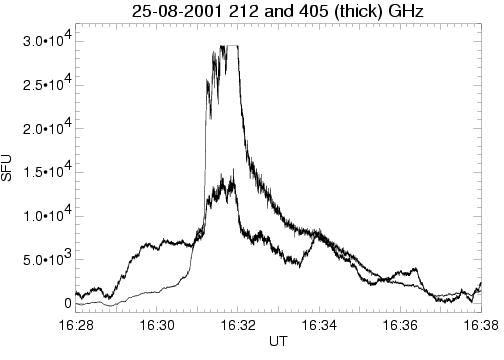
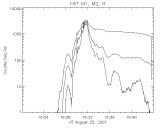
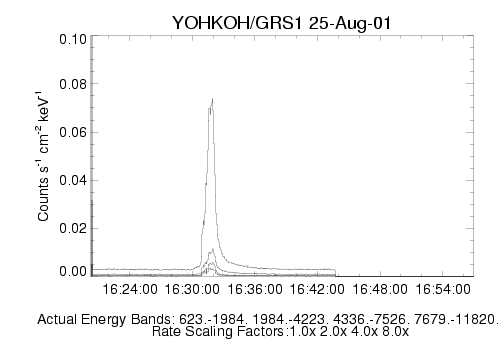
Light curves of our flare
|
|
|
These plots were all done independently by various of the undersigned. We didn't get a white-light plot (but see the next section) and substituted instead the hard X-rays from Yohkoh HXT. However the message is clear: between 16:31 UT and 16:32 UT, a broad-band blast of non-thermal radiation temporarily makes the global spectrum of the Sun (see the spectrum plot above) tend towards white noise (ie, a uniform, rather than a peaked, spectrum). Of course it is not unstructured, and each frequency range contains considerable information about the physical nature of the sources. For example, the HXT and SXT images do not match exactly as expected during this bright maximum.
Frosting on the cake
In days of yore, a "white light flare" was a thing to reckon with. Historically important because of Carrington's 1859 discovery of solar flares, we have never done a science nugget on this fascinating subject! In a white-light flare, locally at least, the flare emissions can be detected even at the peak of the solar blackbody curve (see the spectrum plot above). Thus observations used to be rare and difficult. No longer - we have observatories in space, for which "seeing" plays no role, and we can see beautiful white-light images such as that below:
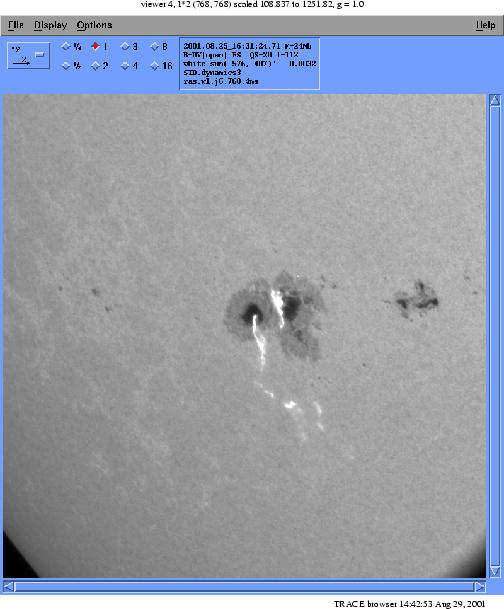
This is the TRACE observation corresponding exactly in time with the soft X-ray image at the top of this page. Please forgive the lack of effort to coalign these images, which have different scales and centers. It is easy to recognize the two-ribbon structure in both images, though. The additional white-light emission to the south of the sunspots falls outside the smaller soft X-ray field of view, tant pis.
Conclusions
In this flare we have a huge submillimeter excess emission, due to relativistic electrons in strong magnetic fields; we have a perturbation of the solar photosphere normally attributed to high-energy particles; we have hard X-rays to show us the lower-energy electrons and we have gamma-rays to show us the relativistic ones and the high-energy protons too. In short, we should have enough modern, high-quality data to understand at last the white-light continuum. This indeed represents a step beyond the pioneering space-based observations of white-light flares carried out with Yohkoh's aspect camera!