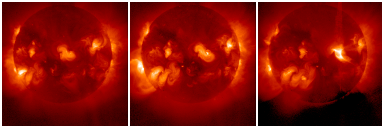
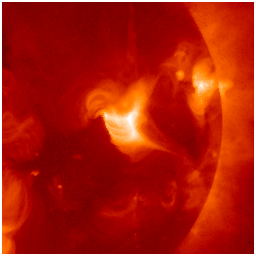
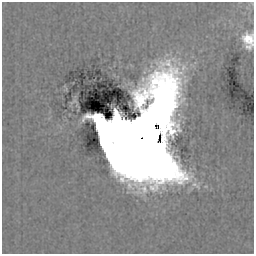
A solar sunspot group with a hot coronal S-shaped structure ("sigmoid") is known to have a higher probability of erupting into a coronal mass ejection. It's therefore one of the tools we are developing for anticipating dangerous "space weather" events. As the original statistics suggested, this tool (like all the others!) does not work perfectly, but... this week it worked like a champ. The SXT Chief Observer noted a faint but distinct sigmoidal active region, NOAA 9684, and notified Max Millennium at 7:40 UT on November 3. Then, at 16:20 UT on November 4, a beatiful energetic flare and CME occurred. Here's the sequence: left, as recognized; middle, the next day; right, after the eruption.

At the time of the alert, note that the sigmoid was not really very bright and perhaps did not look like the most promising active region. It is the object directly at disk center.
What happened
First, let's take a look at this sigmoid in other wavelengths. The movie below shows close-up images of the sigmoid taken almost simultaneously on November 3 (before the eruption). They are a continuum image (observed with SoHO/MDI), a magnetogram (SoHO/MDI), an H-alpha line image (Kitt Peak), and a soft X-ray image (Yohkoh/SXT), which represent the structures in the photosphere (T ~ 6000K), photospheric magnetic fields, the chromosphere (T ~ 10000K), and corona (T > 3 MK), respectively. Between every two successive wavelengths, their overlays are inserted in the movie so that their differences can be seen more clearly.
 Java (0.3MB) and
Mpeg (15kB)
The close comparison of these images shows many things; One can see sunspots only in the very vicinity of the main concentration of the positive polarity (colored white); One can see a dark H-alpha filament running exactly along the magnetic inversion line; The shape of the sigmoid and that of the dark filament are roughly the same, but the curly edges of the sigmoid deviate substantially from the filament in the southern branch (the primary direction of the ejection, as shown next).
This region did erupt about 24 hours later. Here is a movie of the SXT images during the flare. Again, same as the previous week, each frame is a composite of soft X-ray intensity plot (top), wide-angle view (left), and close view of the core part (right). One can see the southern part of the sigmoid is more severely blown away in the southwest direction, and after the flare this part forms gorgeous arcades and later a cusp, as shown in the movie.
 Java (1.45MB) and
Mpeg (1.96kB)
Not only did an event happen, but it was a splendid one for all observers, including us on the Earth:
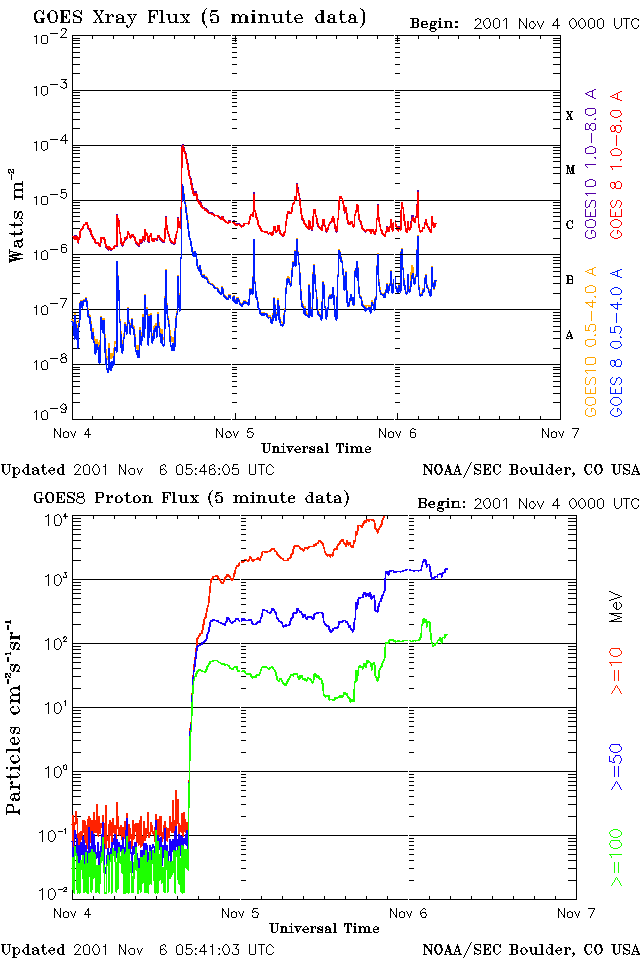
Of course, you must click on the plot above to appreciate its beauty. The top shows X-rays, the bottom "solar cosmic rays" as they arrive at the GOES sensors near Earth. A major geomagnetic storm and spectacular auroras resulted from the arrival of the flare ejecta and their interaction with the Earth's magnetic field. For further developments, since this is developing as we write this nugget, please refer to Today's Space Weather pages maintained by NOAA; they will also point you to explanations of some of these things.
What are we learning?
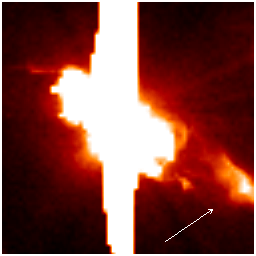
By now we have seen many great flares and CMEs with SXT, but still new things appear, partly because we improve the way we observe as time goes on. Here we have already found two or three novelties which may turn out to be important.
|
|
|
|
|
|
|
|
|
|
|
|
|
|
|
|
|
|
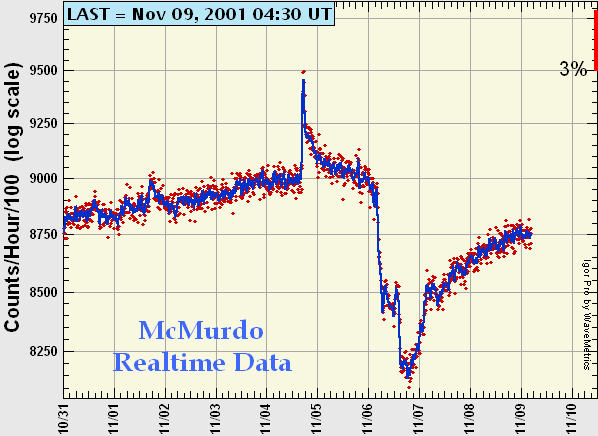
Actuallly, this nugget has already become too long. The other new things we've seen thus far include seventh a rippling effect above the arcade long after the event; eighth hints of a global wave launched to the southwest with the eruption, ninth, another (only the second? - see Share et al., JGR 106, 77, 2001) observation of gamma-rays from the Earth's atmosphere induced by the solar particles, etc.; there will of course be much more in the SOHO and WIND observations.
Conclusion
More evidence here that the sigmoid signature is a real one; at first we had anecdotal evidence and a statistical result based upon proxies. No single event should be regarded as real proof of anything, but this case is so clear and compelling that we are, well, completely convinced. Now the problems are twofold: first, how to convert this sigmoid signature into a more disciplined tool for forecasting and prediction; second, how to make use of this wealth of excellent observation to learn more about the physics of the process we're watching unfold.