Synoptic maps -- the big picture
Science Nugget: February 15, 2002
Introduction -- the Synoptic Maps
Following the style of the last three weeks, we'd like to present one more
highlight from the Yohkoh 10th anniversary meeting.
Featured in this week's nugget are synoptic studies, or more
specifically, studies done by using 'synoptic maps' made of SXT images.
The principal meaning of the word, 'synoptic', according to the
Merriam-Webster dictionary,
is 'affording a general view of a whole'.
Examples most familiar to us may be the synoptic charts of meteorology,
which are the weather maps showing atmospheric isobars, wind speeds, etc.

|
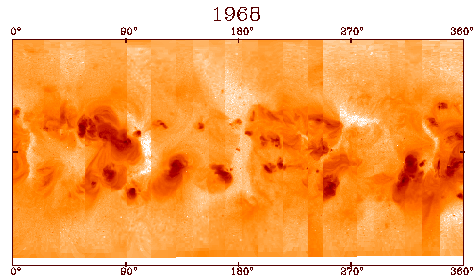
In the context of solar physics, on the contrary, 'synoptic maps' usually
represent the kind of images shown on the left. This particular image,
made from 27 consecutive days of SXT full-disk images, is prepared
by slicing a thin area located at the central meridian from each image
and ranging them in order of time. Since the interval of the data (27 days)
corresponds to nearly one solar rotation, the image approximately shows
the corona above the whole surface of the sun.
Of course the slices are not contemporaneous, but this helps to get a
global view of the coronal structures; e.g. the distribution of active
regions or extension of coronal holes, especially if they are long-lived.
|
Synoptic maps naturally have more variety.
One can collect slices through much longer periods of time (e.g. for a
solar cycle or more), or collect slices from other longitudes of the solar
disk (e.g. at 30 degrees from the central meridian., or even at the limb
or off-limb regions).
It is needless to add that one gets different views from different sources of
data (e.g. photospheric magnetic field or coronal emission-line images).
Each type of synoptic map has its own suitable role, as introduced in the
following sections.
Global activity patterns in the corona
|
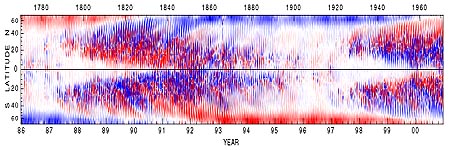
The image on the right is a synoptic map of the photospheric magnetic field
taken from the
Mt. Wilson Observatory .
Such synoptic maps covering more than one solar cycle show two outstanding
intensity enhancements: these start around 30 degrees in latitude at the rising
phase of the solar cycle and gradually migrate toward the equator.
These main structures in both hemispheres clearly correspond to the
emergence of the sunspots or smaller active regions.
On the other hand, poleward-migrating structures (note the opposite
colors, which denote magnetic polarity) are noticed at higher
latitudes.
Those are much weaker than the main structures but are
well detected in
the coronal line emissions, typically in the rising phase of the solar cycle.
These two types of global streams on synoptic maps are sometimes referred as
'low/high-latitude coronal activity waves',
respectively.
|

|
Identifying the counterpart of the 'high-latitude waves'

|
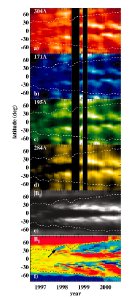
From the coronal EUV intensities obtained with SoHO/EIT, E. Benevolenskaya
et al. at Stanford University showed in their ApJ paper
(vol.554, L107-L110,
2001, from which the left image is taken)
that the high-latitude waves are caused
by giant magnetic loops connecting the polar magnetic fields
with newly emerged active regions at mid-latitude.
In the left image, synoptic maps of four different
wavelength bands in EUV and of
the magnetic fields are shown, from the late minimum to
the early rising phase of
the last solar cycle. White dashed lines represent magnetic neutral lines.
High-latitude activity waves are clearly seen in EUV maps a little polewards
of the neutral lines.
At the Yohkoh meeting, Benevolenskaya presented their further
study on this topic using SXT synoptic maps.
Because SXT is sensitive to hotter plasma than EIT, the high-latitude waves
are not steady structures but appear 'impulsively' when the activity at
lower latitude is high enough.
In the image on the right, SXT synoptic maps with two analysis filters
(AlMg and thin Al.) are shown together with those of magnetic fields
and EIT/171 images.
The 171A wavelength shows million-degree plasma, whereas SXT typically
shows coronal material at two million degrees or higher.
The symbols I, II, and III with arrows show the low-latitude waves,
high-latitude
waves, and an example of the 'impulses' of high activity.
She then added that the bright polar footpoints of the giant loops in
EIT images are visible as whole loop structures in the SXT.
Further, Benevolenskaya and her co-workers investigated the relation
between the soft X-ray flux and the magnetic flux, and derived a power
law with an averaged index close to 2, which varies with the phase of
solar cycle.
|

|
Detecting the large-scale and long-lived coronal structures
We would like to introduce one more study, which is based on the SXT
limb
synoptic maps.
As the name shows, limb synoptic maps are made of the X-ray intensities
at the limb (or just above the limb), and provide a different view of the global
corona.
|
J. Li at University of Hawaii presented whole-limb synoptic maps made of
SXT images from 1991 to 1999 (image on the right). Its reference height is
from 1.000 to 1.015 solar radius. She and her colleagues detected some global
structures on this map: e.g. coronal butterfly
patterns, which correspond
to the 'low-latitude wave' of the previous section, coronal holes, and
coronal polar sinusoids, which are related to
large-scale streamers above active regions.
|

|

|
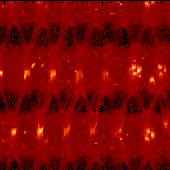
The polar sinusoids are hard to identify in the long-term image above,
but are clearly seen in the image on the left (close-up around the 1996
portion).
One can notice bright spots alternatively showing up on the eastern and
western limbs. Those spots correspond to the active regions appearing on
the east limb, rotating across the disk, showing up again on the west
limb;
then, rotating across the invisible hemisphere before
showing up again on the eastern limb as they rotate onto the disk again.
One can also notice the bright bridges connecting the neighboring spots
on both limbs.
They are thought to be formed by high-altitude plasma far above the active
regions, and visible over the polar regions due to projection as they rotate.
Polar sinusoids are defined as this system of bright spots and bridges,
as named by Li et al..
|
They especially focused on the polar sinusoids which appeared from 1996 to 1997,
and found that each sinusoids have lifetimes of several solar rotations,
which is much longer than those of the active regions at their root.
Checking carefully the location of the sunspots related to the sinusoids,
they finally concluded that the sinusoids are produced by non-contemporaneous
sunspot clusters, in which formation and decay of the sunspots are repeated
up to a year. The details are described in their ApJ paper
(vol.565, p. 1289-1297, 2002).
Closing remark
Yohkoh is a flare mission. Therefore, studies on the energetic and
drastic phenomena like flares and CMEs were naturally flourishing at the
10th anniversary meeting. In addition, Yohkoh has acquired a
tremendous asset in its
unique accumulation of 10 years of synoptic data in the X-ray wavelength range.
Although one must admit the session on the solar cycle, in which synoptic
studies are included, was a minor one at the Y10 meeting, studies like those
introduced above are important and worthwhile. Frankly speaking, the author
of this nugget is one of those who enjoyed the solar cycle session most,
and she hopes to add some significant contribution to this field.
February 15, 2002
A. Takeda
(takeda@isass1.solar.isas.ac.jp), with thanks to E. Benevolenskaya
and J. Li.
