Precise hard X-ray measurements
We are all quite pleased with the TRACE observations, which have exquisite angular resolution and show the solar corona to be finely striated by its magnetic infrastructure. See last week's nugget for a sample image. People may not realize that hard X-ray imaging may be comparably precise. For hard X-rays one cannot use classical optical techniques, for the simple reason that glass (or its metallization) simply absorbs the photons, rather than reflecting them. Instead one uses seemingly crude shadow masks, or "modulation collimators" following their invention in the 1960s by Oda and Wada for X-ray astronomy. These devices encode the spatial structure of an astronomical field in various ways, often via scanning - the moving shadows provide a time-varying signal that can be decoded to produce an image. The resulting image may be fuzzy and look imprecise, but in fact may be quite precise in some ways.
We compare hard X-ray observations from the Yohkoh HXT and RHESSI. Here the objective is to measure the apparent motions of footpoint sources, which we think of as the photospheric intersections of coronal magnetic flux tubes. Let's look at the data first and then ask why we want to do this.
The significance of this observation, independent of the intepretation we provide below, is that the measurement of centroid separation is extremely precise. The HXT collimator has a finest "pitch" of about 8 arc sec, and yet the points track along coherently with an RMS scatter about some trend that does not exceed one arc second. In this sense the primitive HXT modulation collimator is apparently extraordinarily precise.
What about RHESSI?

|
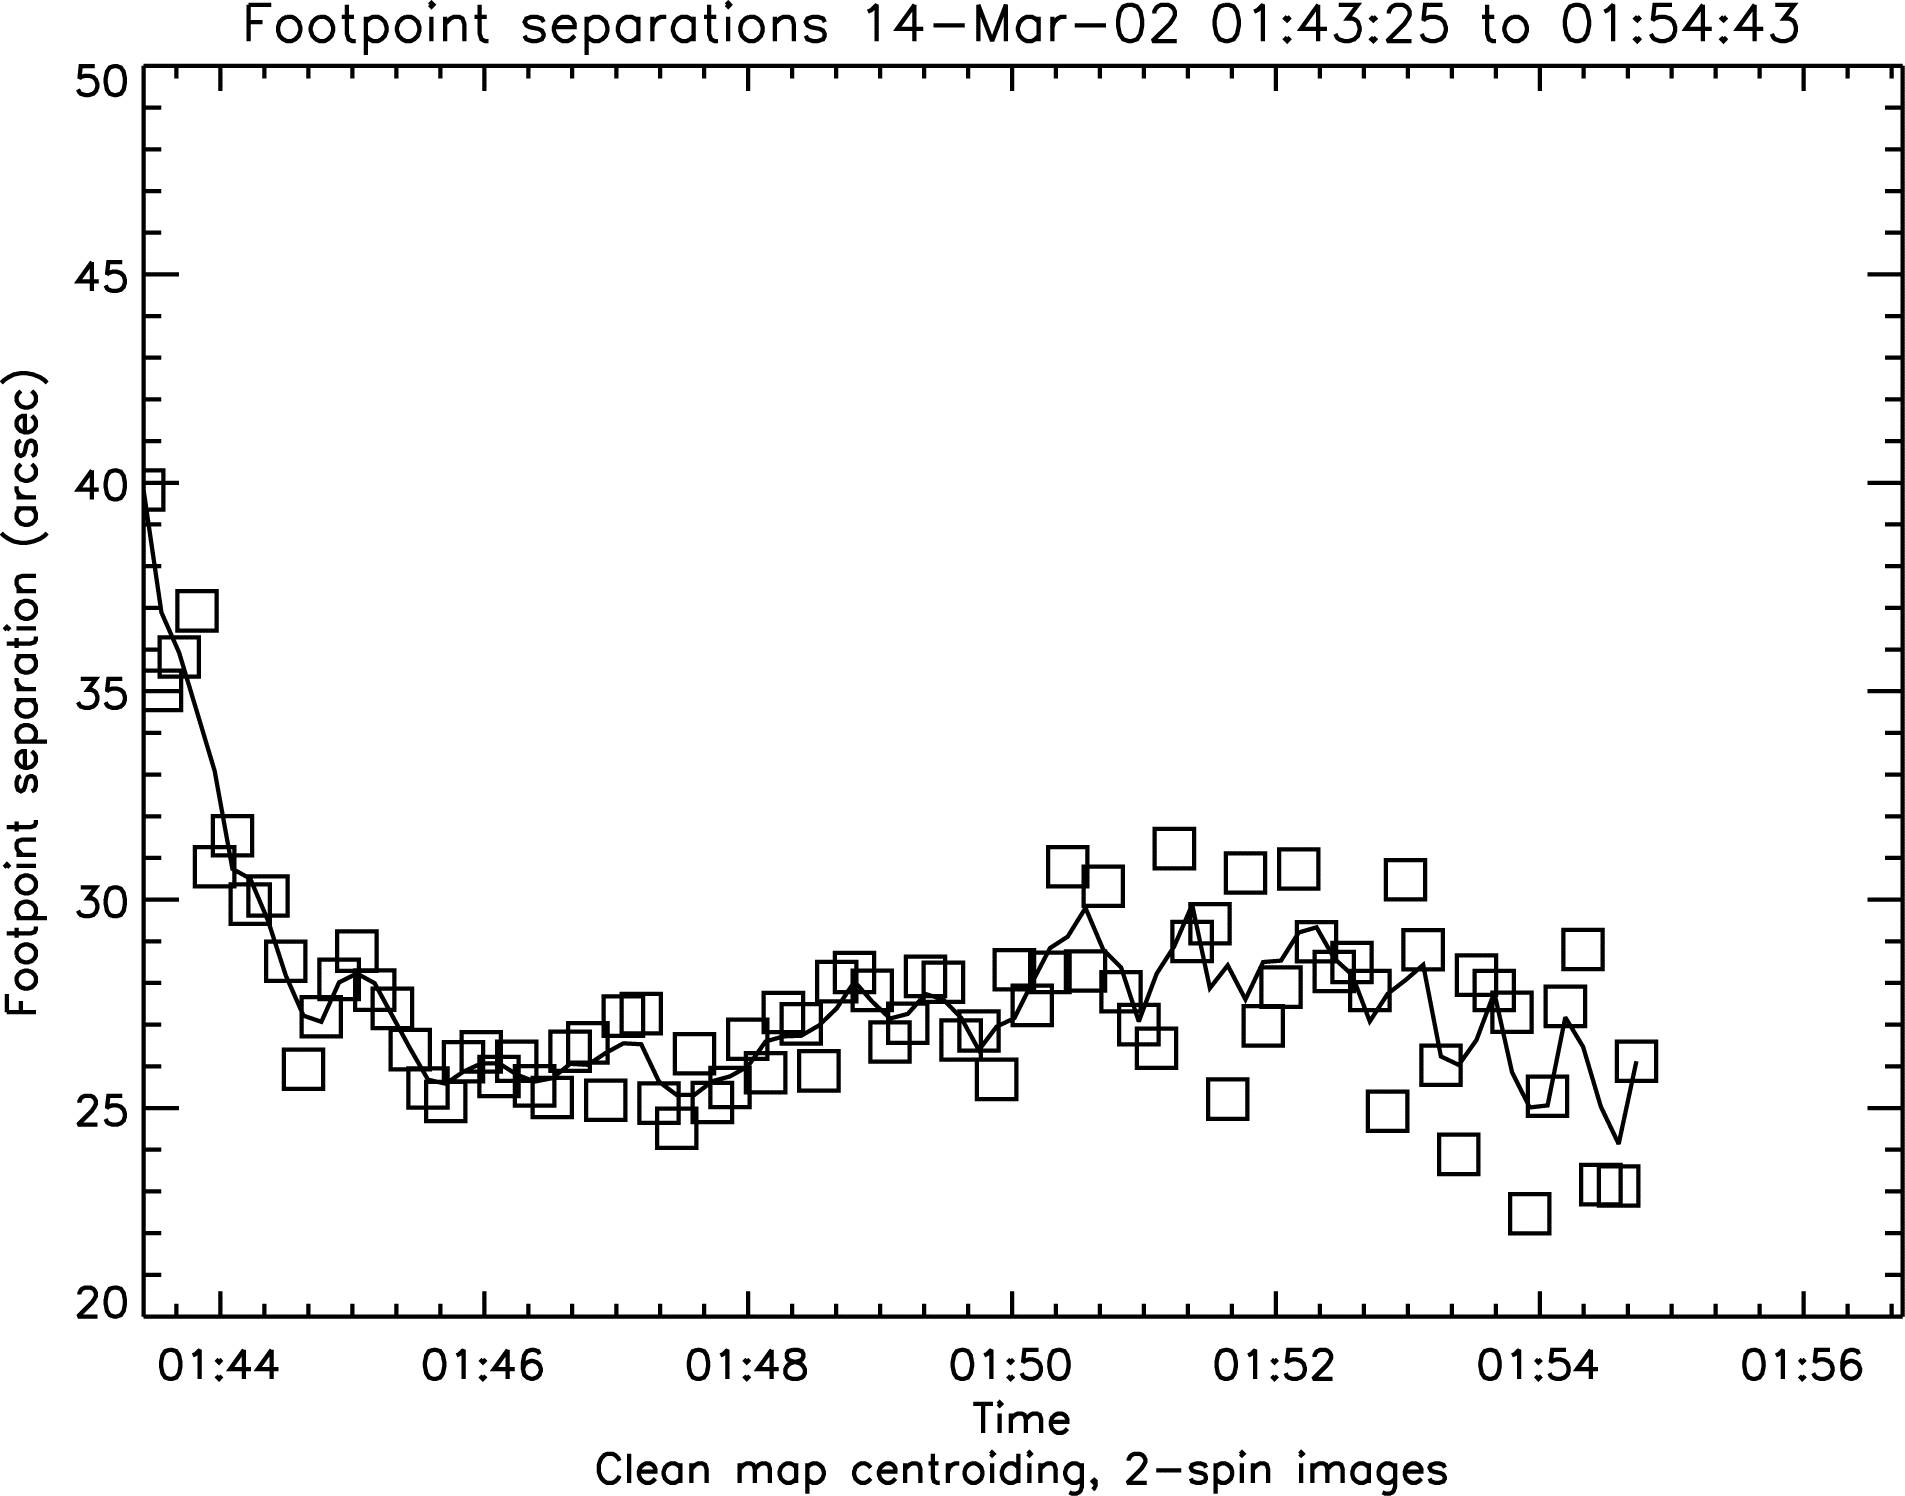
A similar footpoint-separation plot for a fainter flare observed recently by RHESSI, as analyzed by L. Fletcher. Here the integration time is 8 sec and the energy band 20-30 keV. Again, in the central part of the time series one can see arc-sec precision (recall the rule of thumb: rms fluctuation is about 1/4 of the peak-to-peak fluctuation). |
In the HXT example above, an analysis showed that the scatter of points was close to the fundamental limit of the measurement. This is imposed by counting statistics and would roughly be estimated by dividing the angular scale of the measurement (2*8 arc sec for HXT) by the square root of the number of photons detected. No real analysis of the RHESSI data has yet been done, but this limit should be achievable. In the case of RHESSI, the aspect sensor is working marvelously and we should be able to coalign the hard X-ray centroid positions with (say) radio observations at better than one arc sec. Amazing!
In each of the observations the limit on perceived footpoint motion is still too high to be physically meaningful as an actual motion, in the sense that the photospheric material does not flow so fast; hence we are observing something like a conflagration. The conflagration here is a magnetic one, in that the footpoints reveal a series of magnetic field lines that map up into the corona where the energy is stored - not only that, but the hard X-rays show where the energy is released from this storage. The cartoon shown below, drawn originally by P. Cargill and E. Priest, shows the kind of thinking involved here.
The cartoon interpretation, alas, doesn't match the observations very well. In an over-simplification, the model requires that the footpoints move more rapidly apart at time when the energy release is the most intense. Neither the Sakao (HXT) nor Fletcher (RHESSI) observations show this effect. At present we don't have good predictive theories to compare with (but we do have nice cartoons!) so we do not know whether this apparently failed prediction really means very much. But the data, as one can see, are excellent, and we hope that a firmer answer (is the theoretical framework right?) will be availble for a future nugget soon.
August 30, 2002
Hugh Hudson (hhudson@ssl.berkeley.edu)