July 20, 2009
Starting to complete the data that I need to finish my project.
-Redo RHESSI images using the newly learned settings
*Clean Images
i) Use detectors 3-9
ii)use uniform weighting
iii)In advance settings change the clean beam width factor to 2
*Pixon Images
i)set image dimensions(pixel) 64x64
ii) assuming to use uniform weighting
iii) set Pixon parameters to Fast Algorithm **only if you have higher than 300 MB
iv) In advance settings increase pixon sensitivity to .5
-Redo Mdi
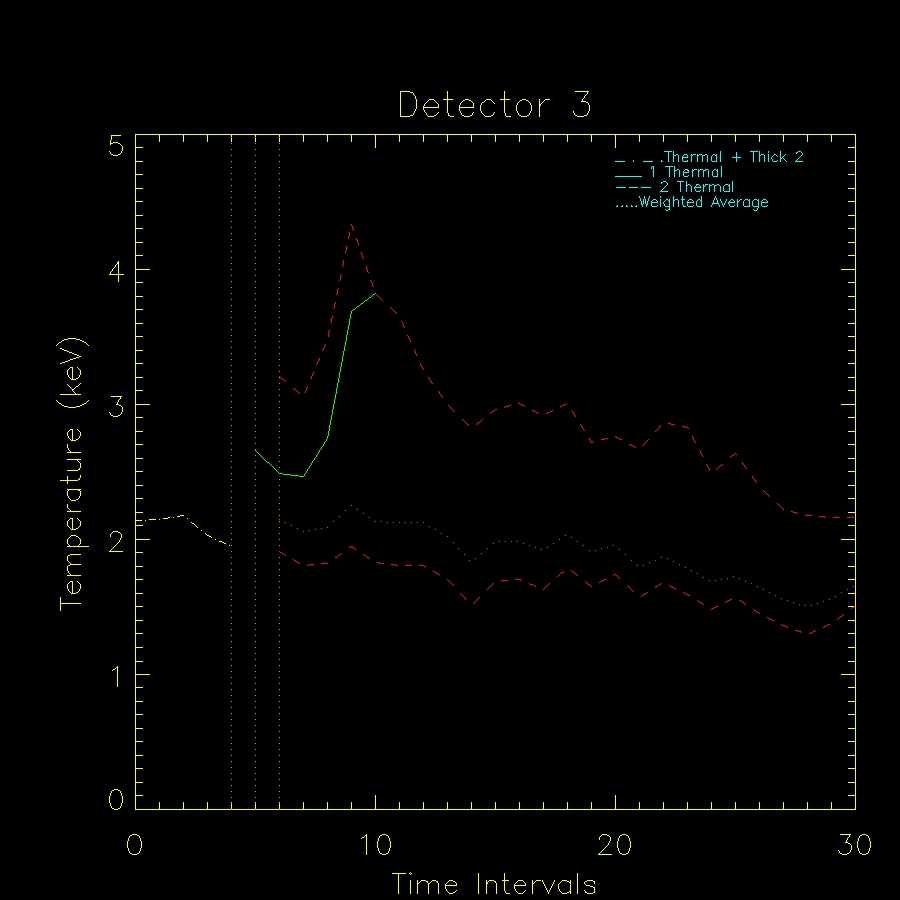
-Complete the graphs that displays the data from the spectral graphs.
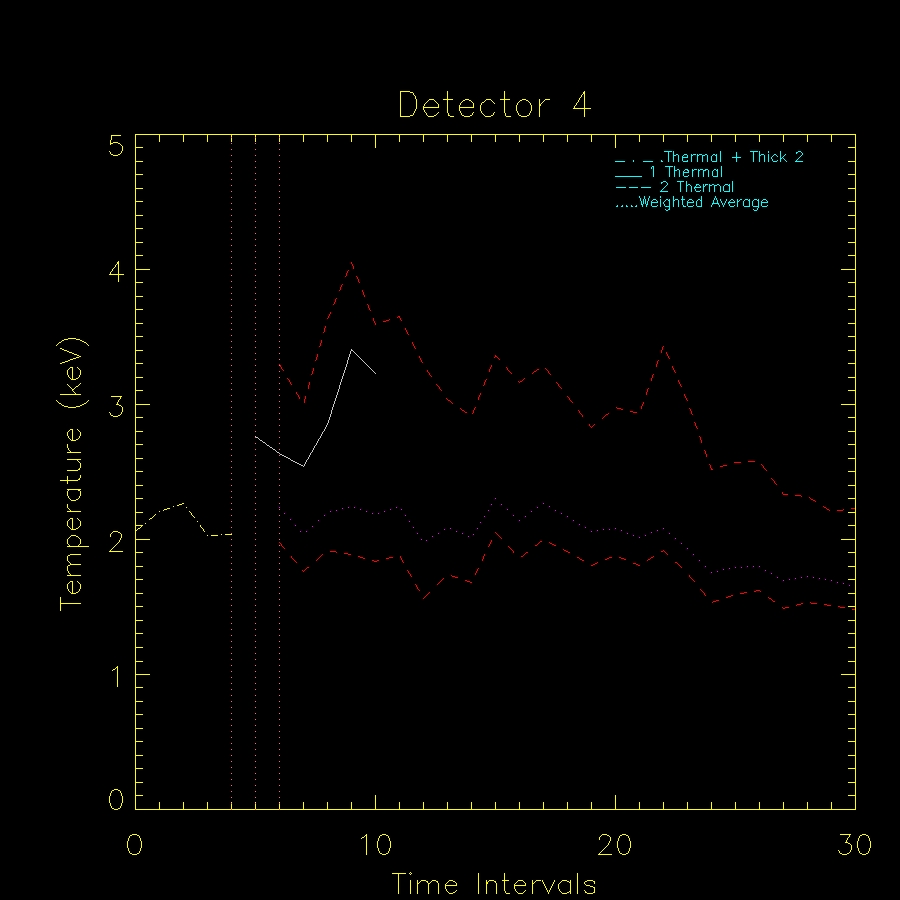
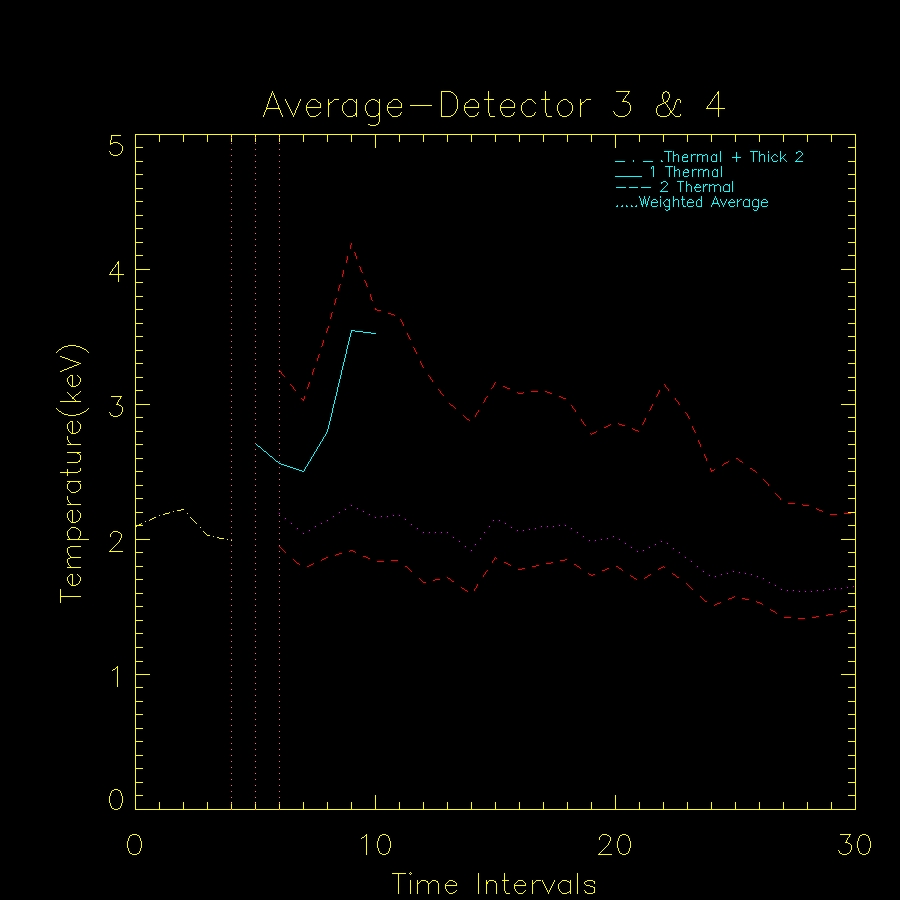
i) time intervals vs temp(keV)
*Detector 3 and 4
* weighted average with respect to the emission measure
*An average over both detectors 3 and 4
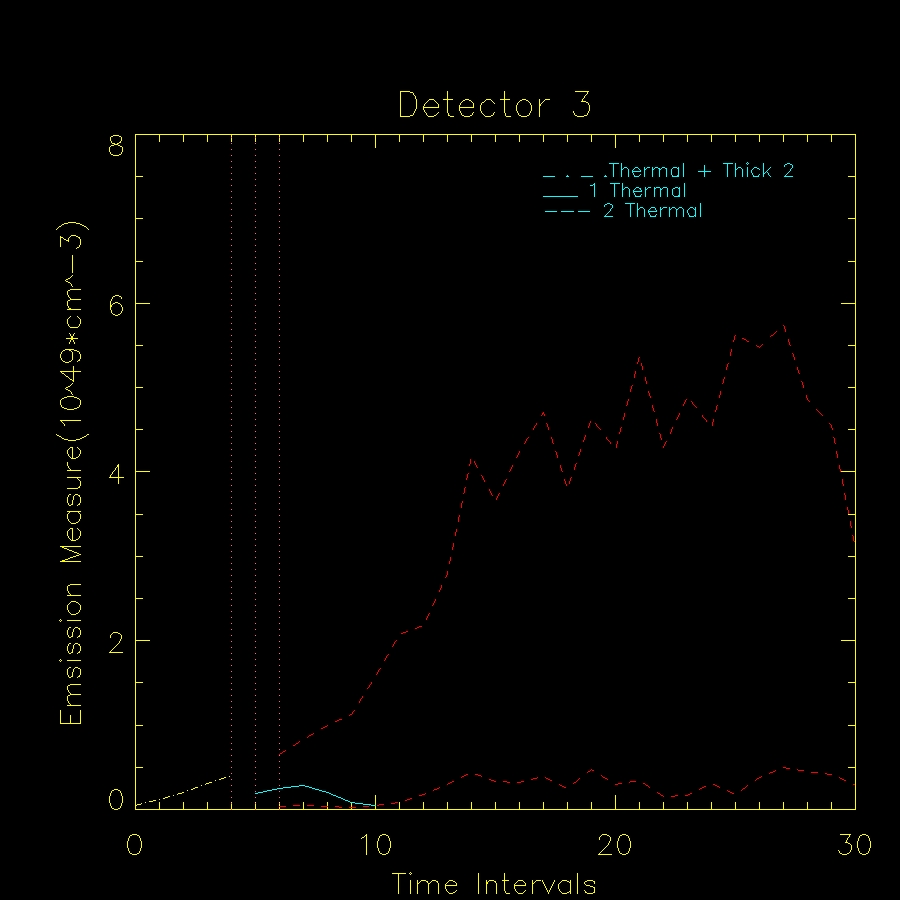
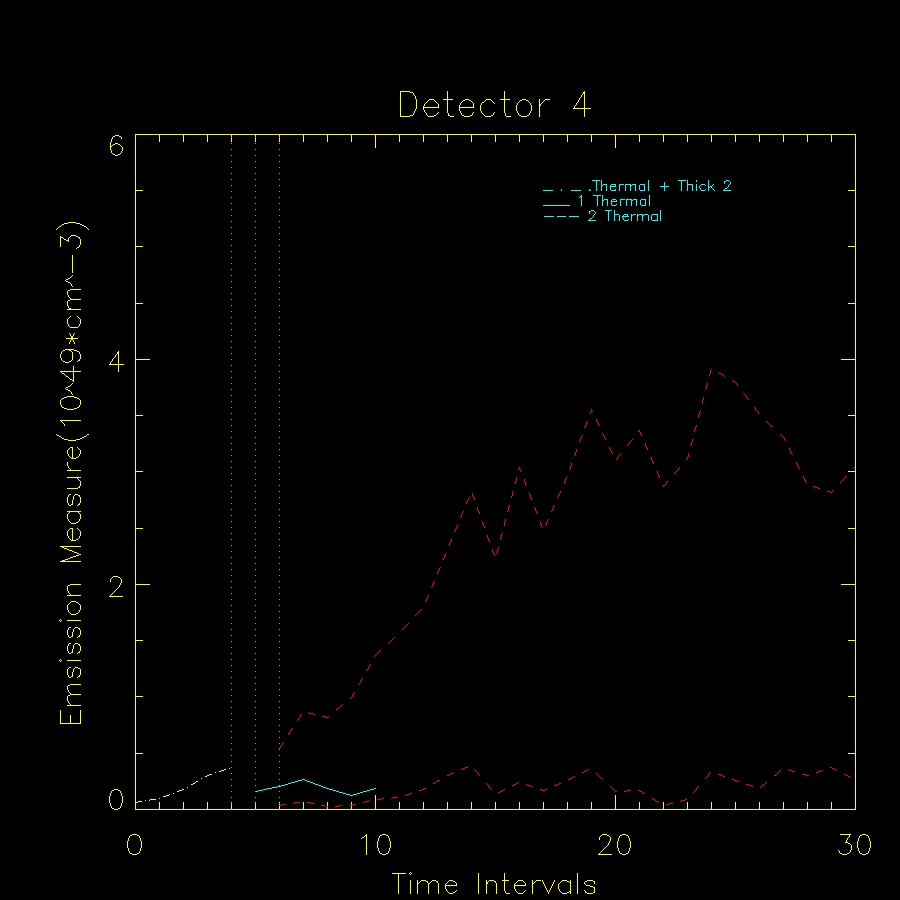
ii) time intervals vs emission measure (10^49*cm^-3)
*Detector 3 and 4
*weighted average- Question: Do I take the weighted average with respect to emission measure if I'm graphing time vs emission measure? or Should I take the weighted average with respect to temperature? If so how do I calculate the weighted measure with respect to temperature in order to have the units in volume?
* An average over both detectors 3 and 4
-Complete the overlay with the TRACE Data
i)overlay topology
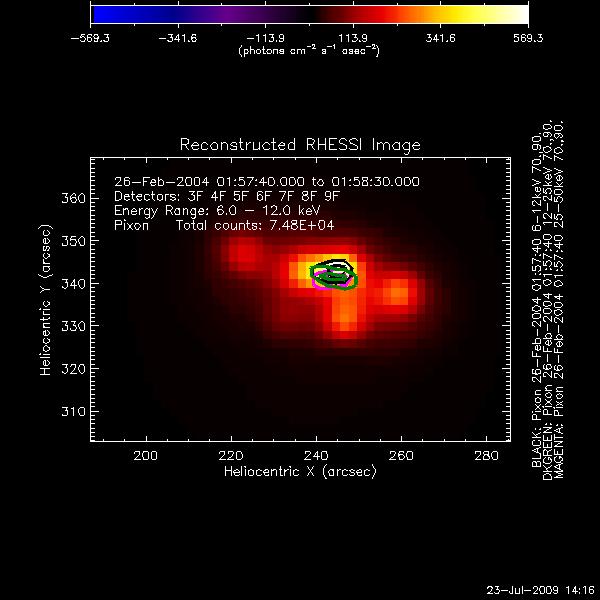
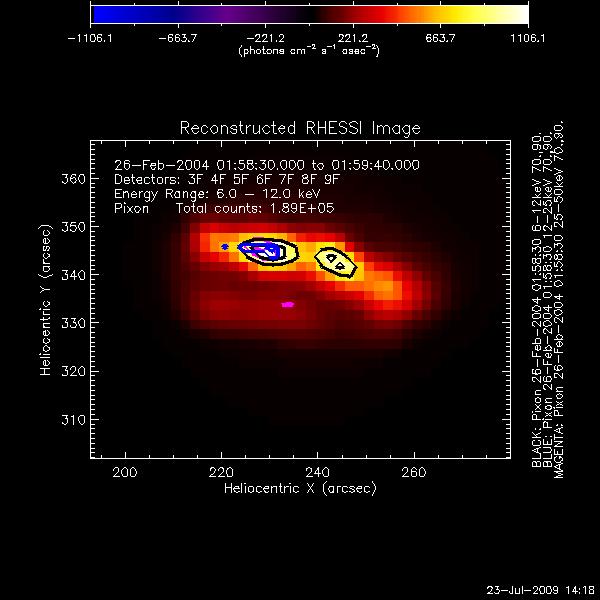
ii) overlay RHESSI contours
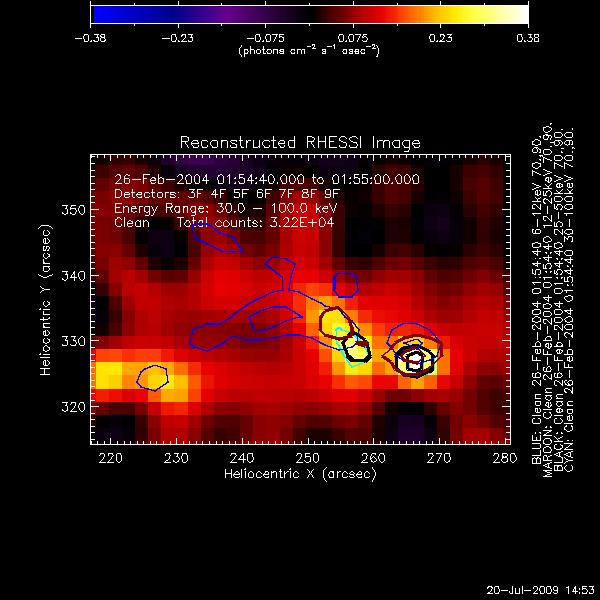
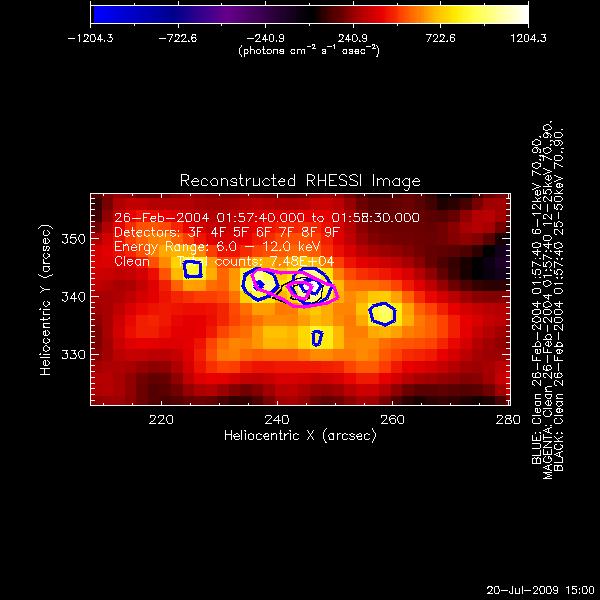
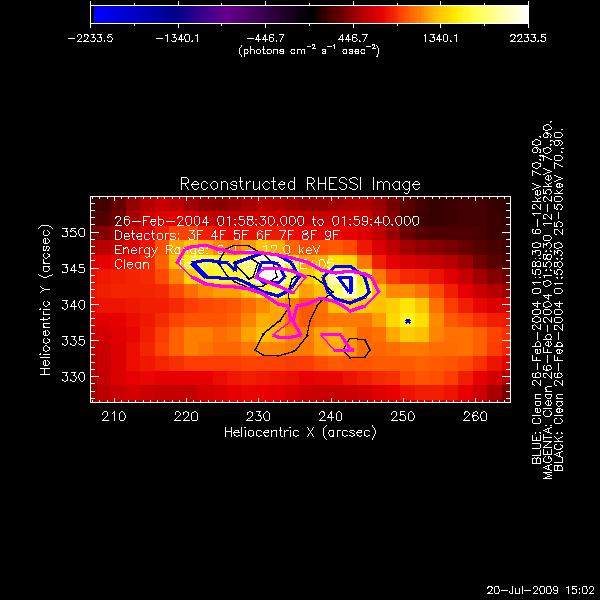
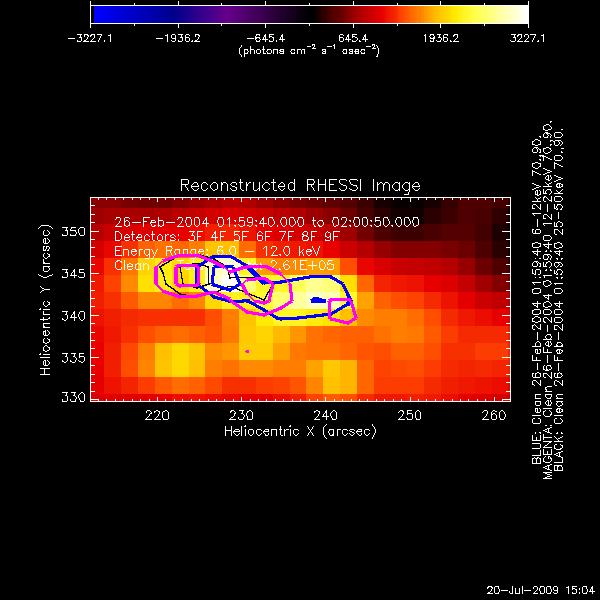
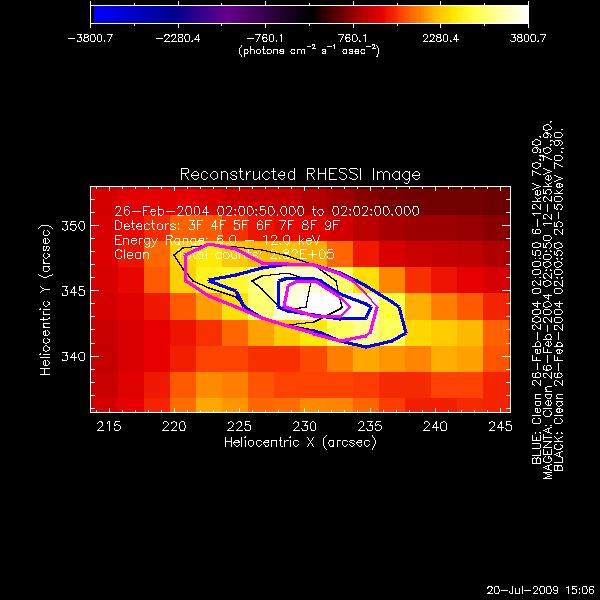
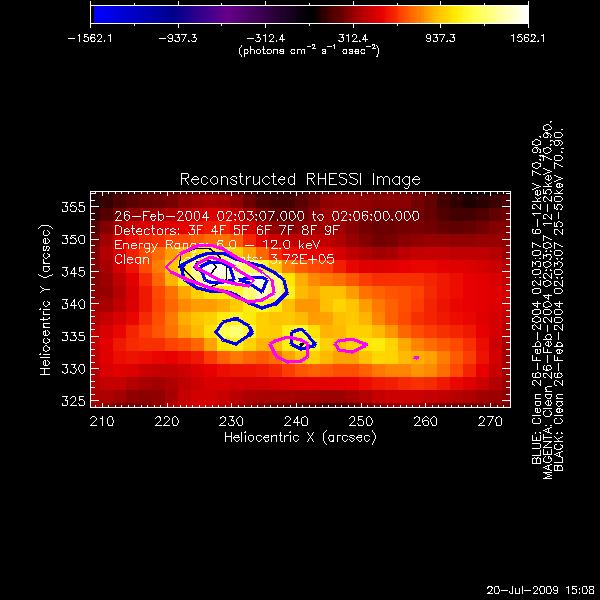
As of today I've made new RHESSI images using the clean algorithm. The results are different from the first time I made the images and this made me think that they can be right or I need to use Pixon to have a clearer image. The results are as follows:
Energy contours ranging from:
6-12 keV-blue
12-25 keV-maroon
25-50 keV -black
30-100 keV-cyan
July 21, 2009
Time vs Temperature
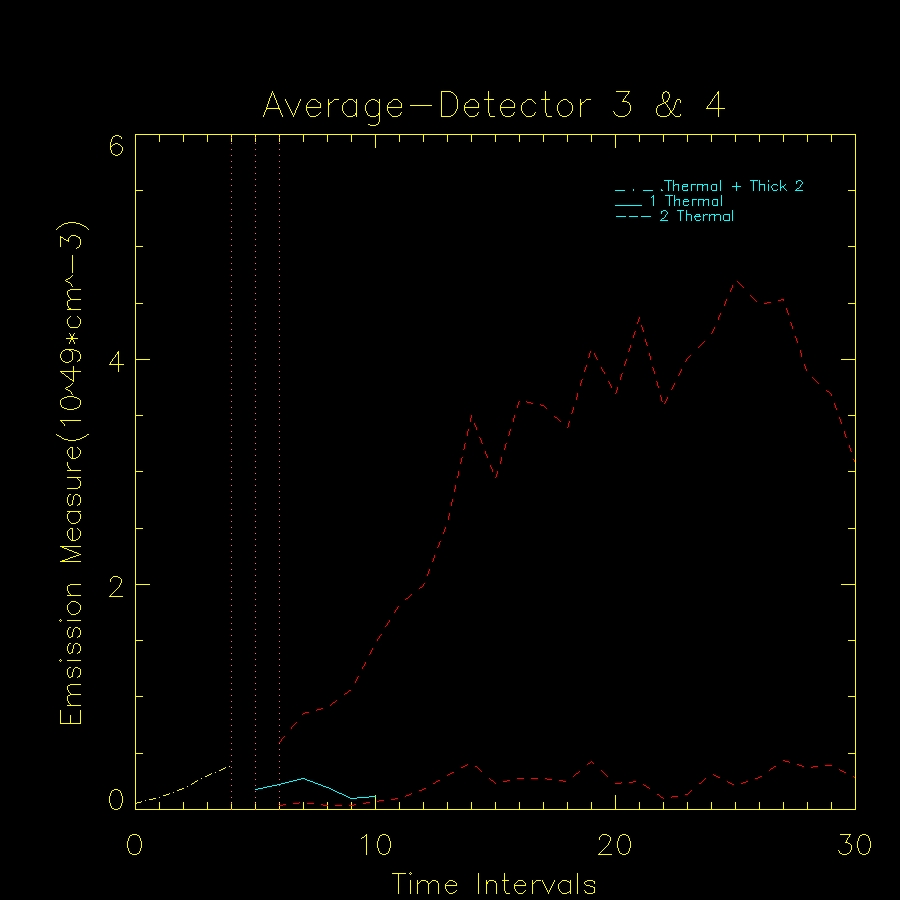
Time vs emission measure
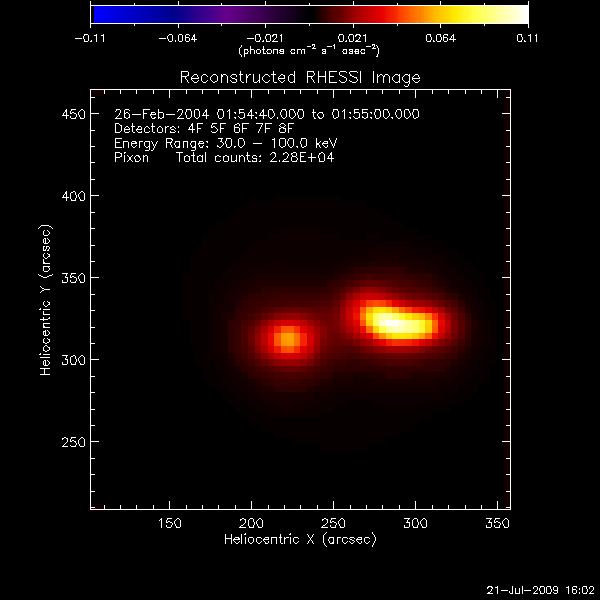
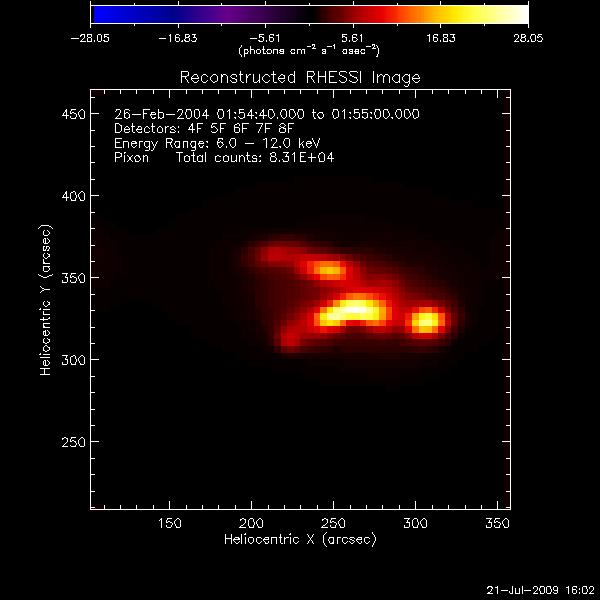
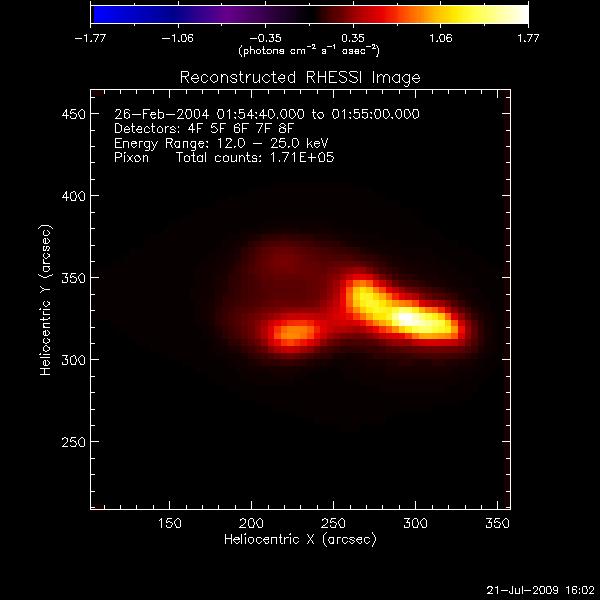
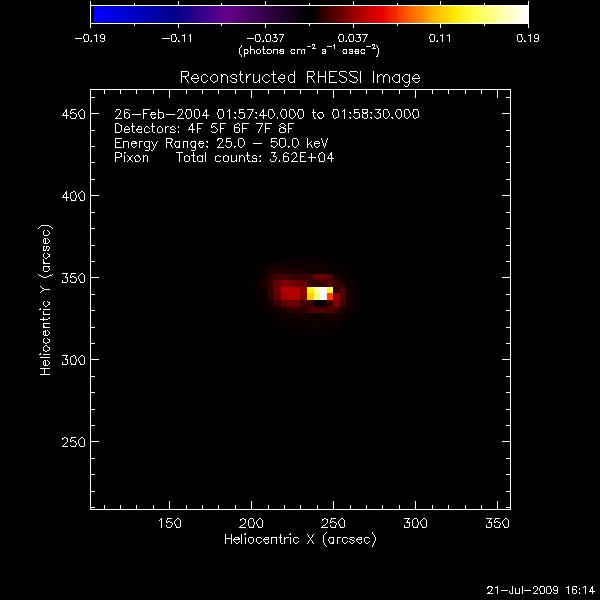
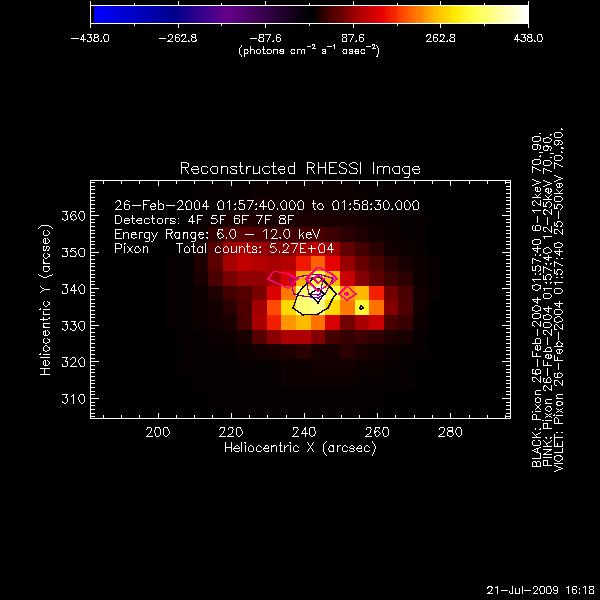
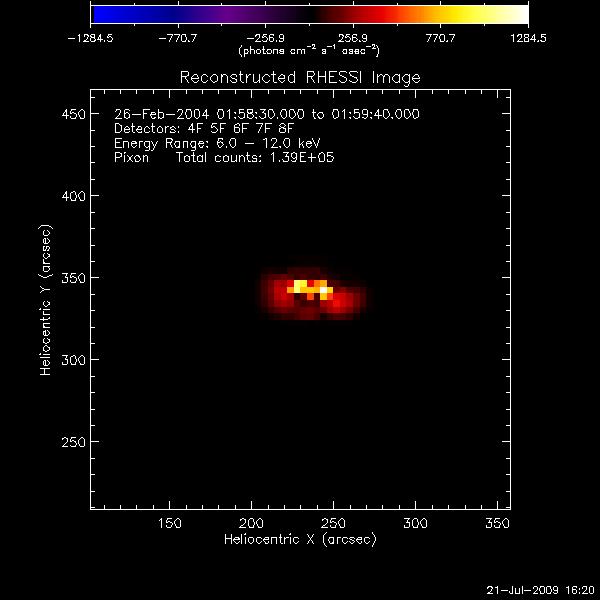
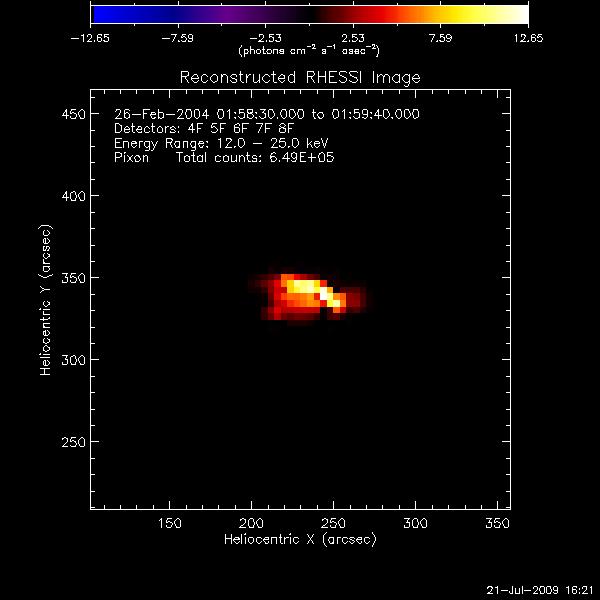
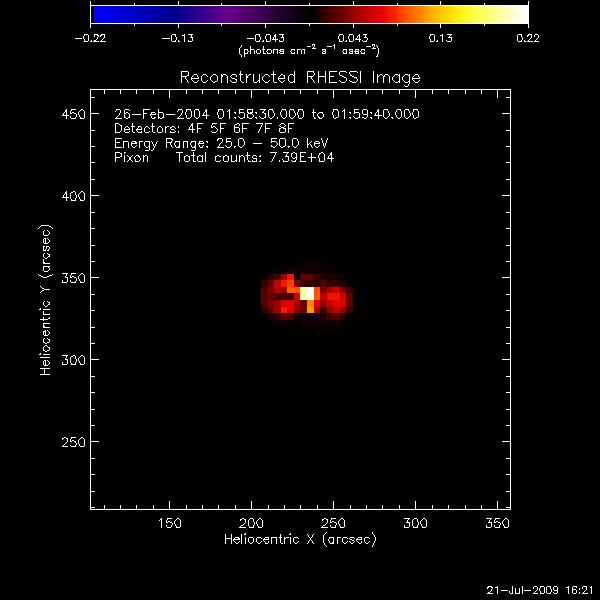
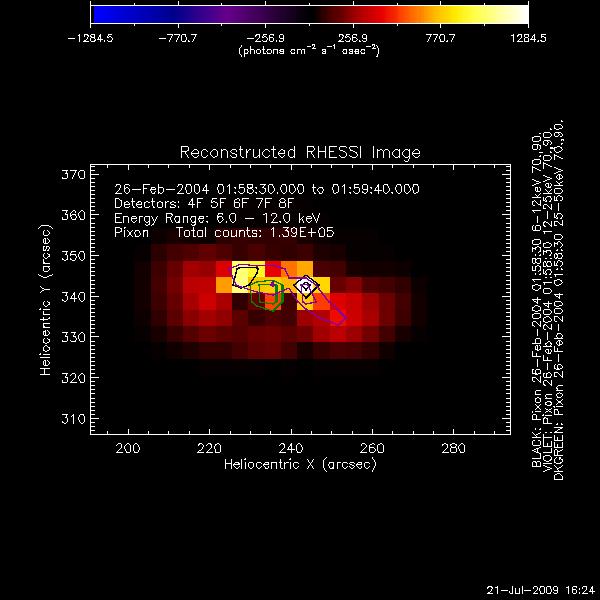
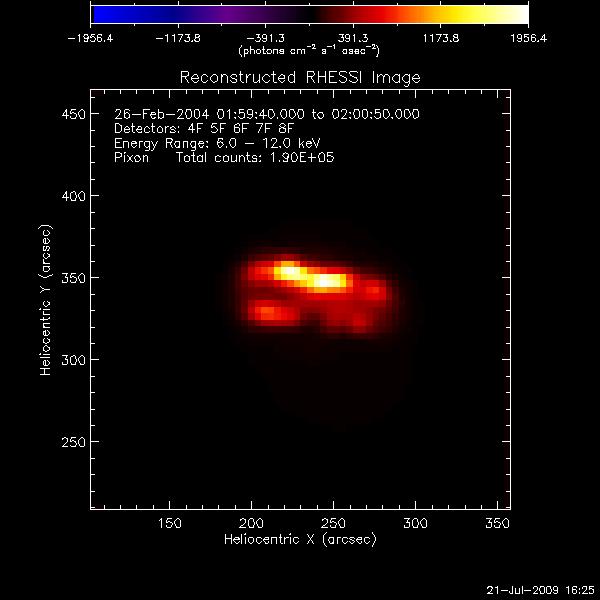
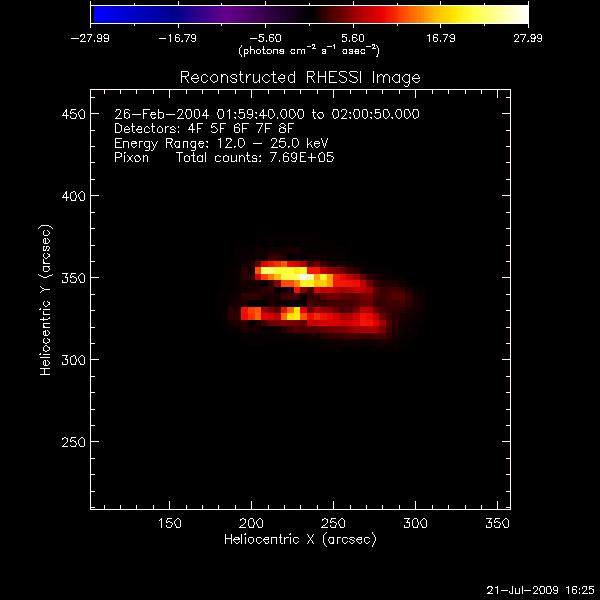
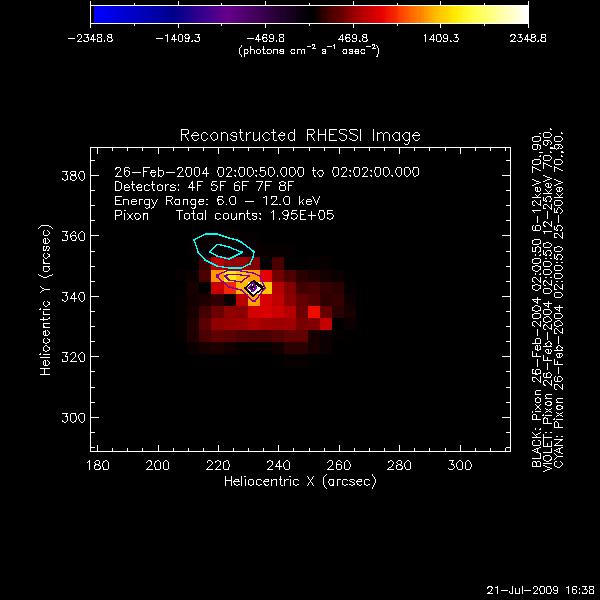
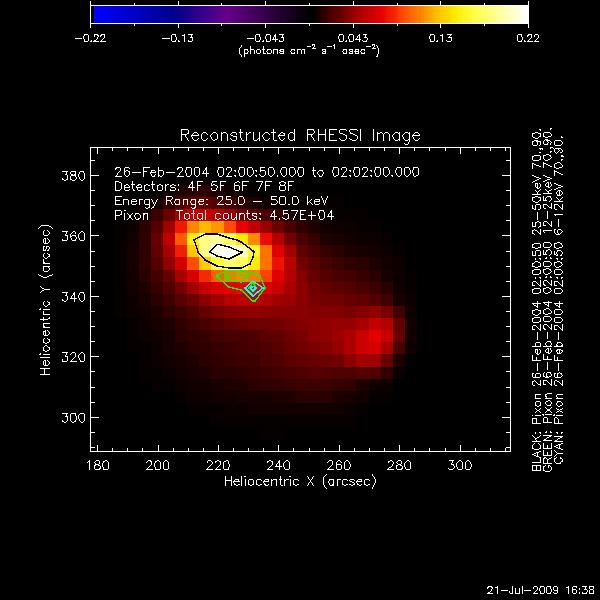
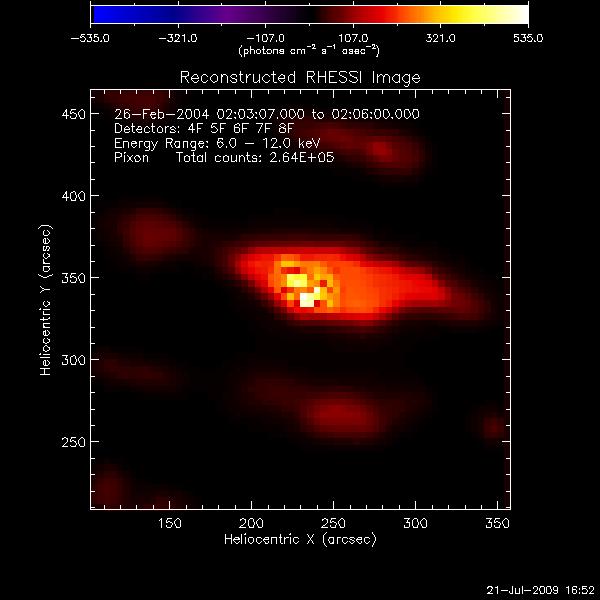
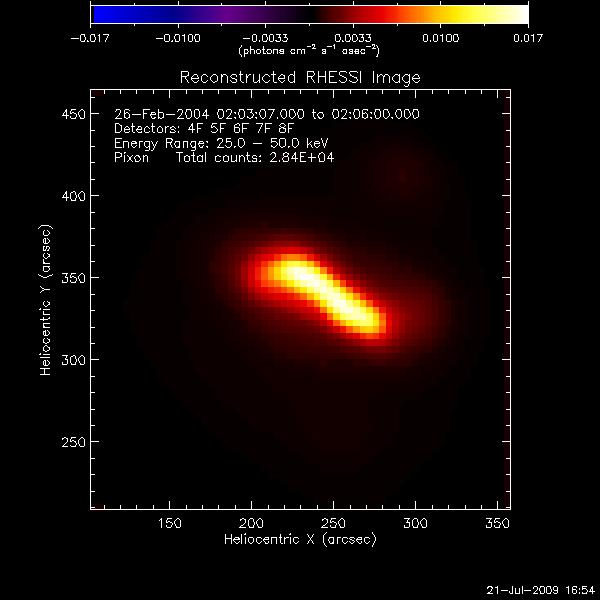
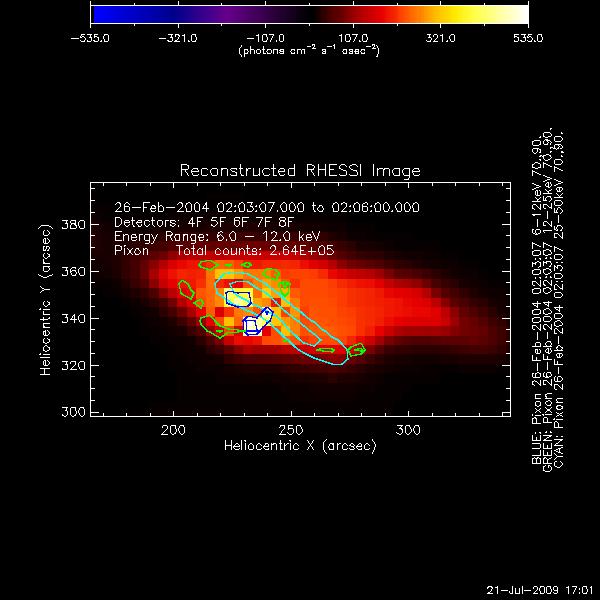
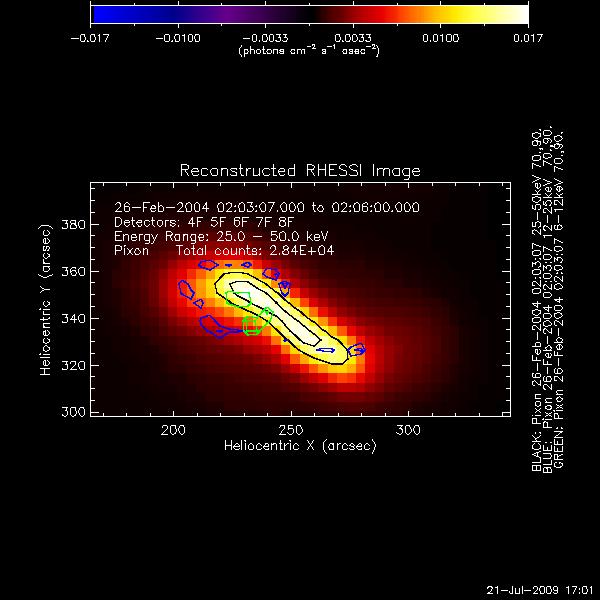
Made Pixon images but the only setting that RHESSI would not let me change was the detector setting. I was forced to use detectors 4-8.
Time: 1:54:40-1:55:00 UT
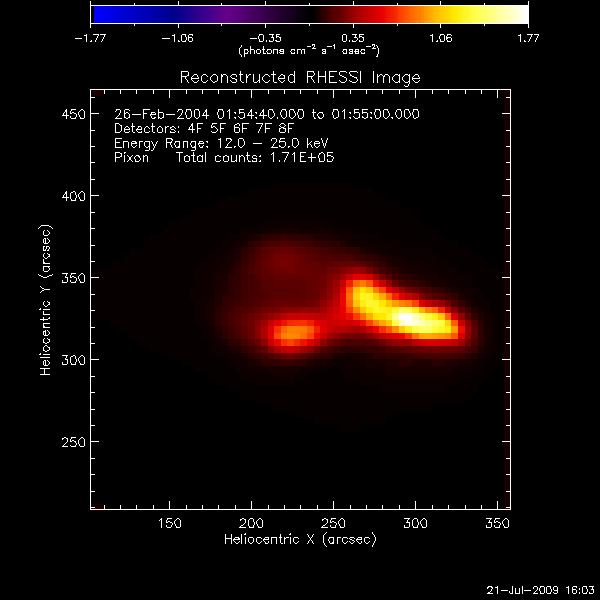
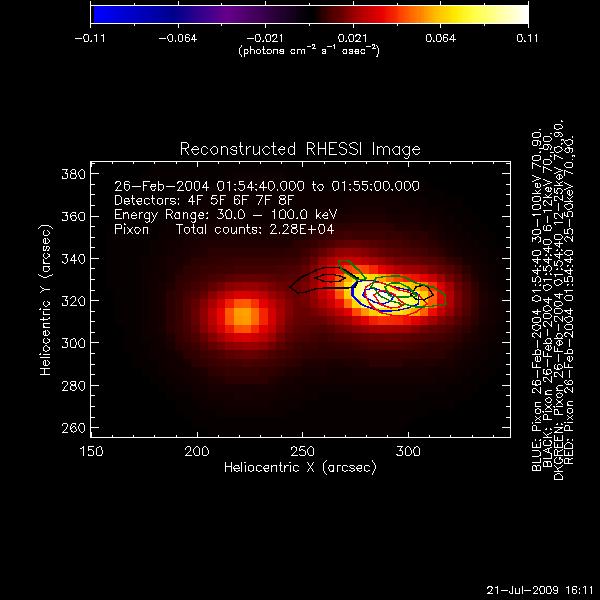
Time:1:57:40-1:58:30
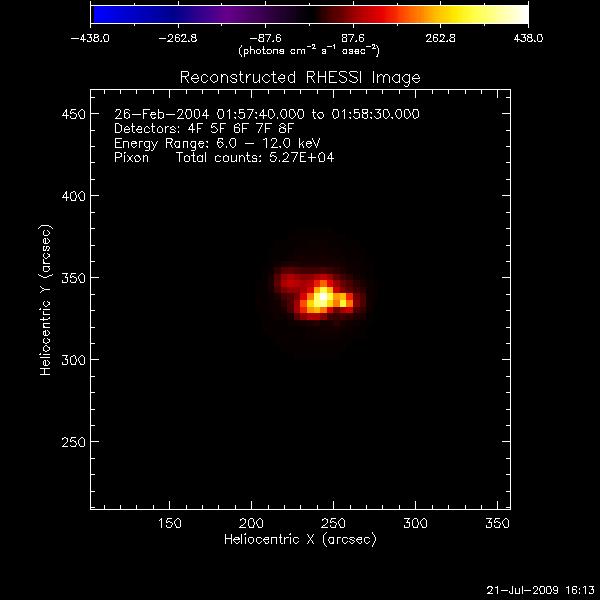
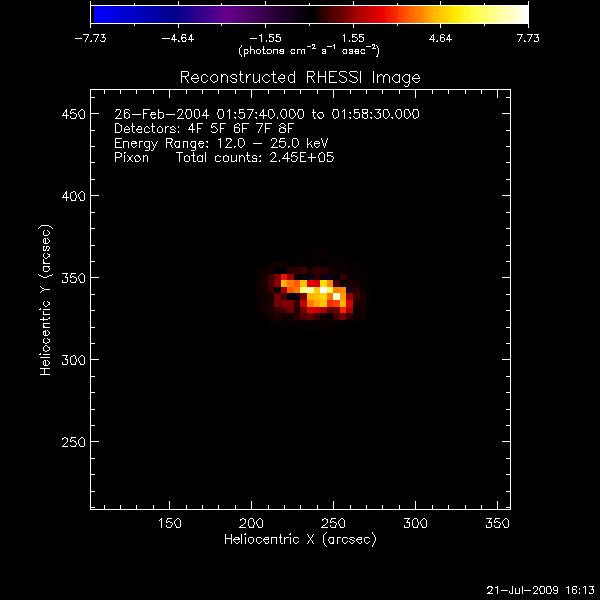
Time:1:58:30-1:59:40
Time:1:59:40-2:00:50
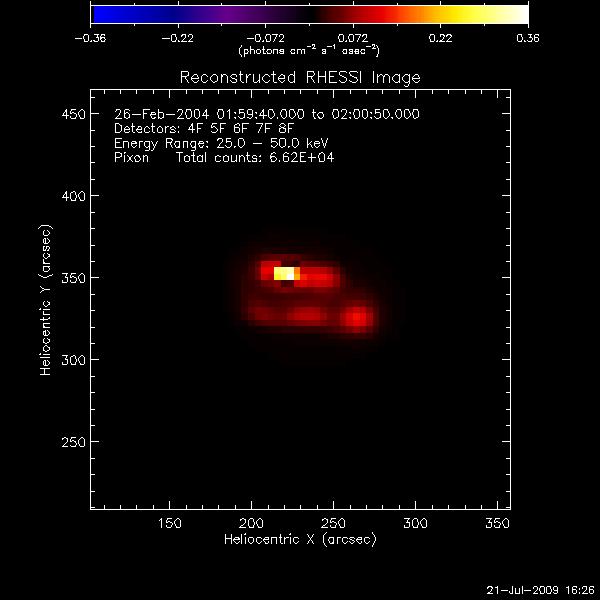
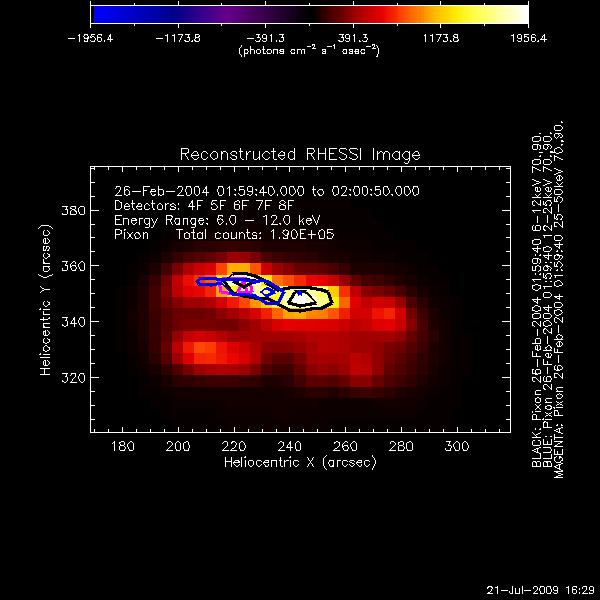
Time:2:00:50-2:02:00
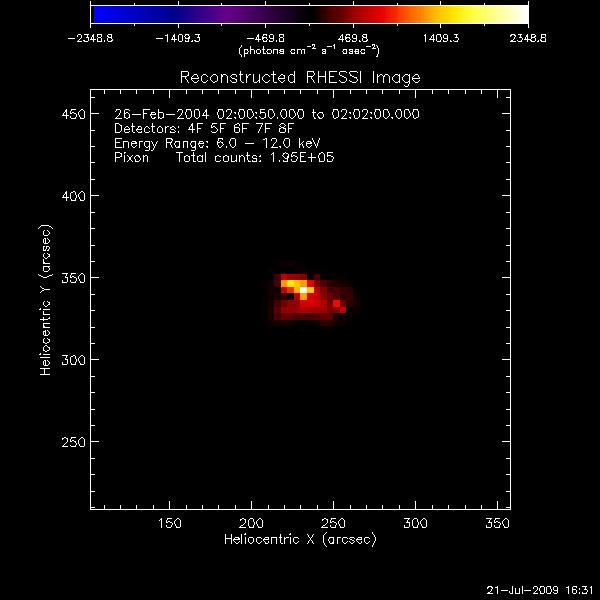
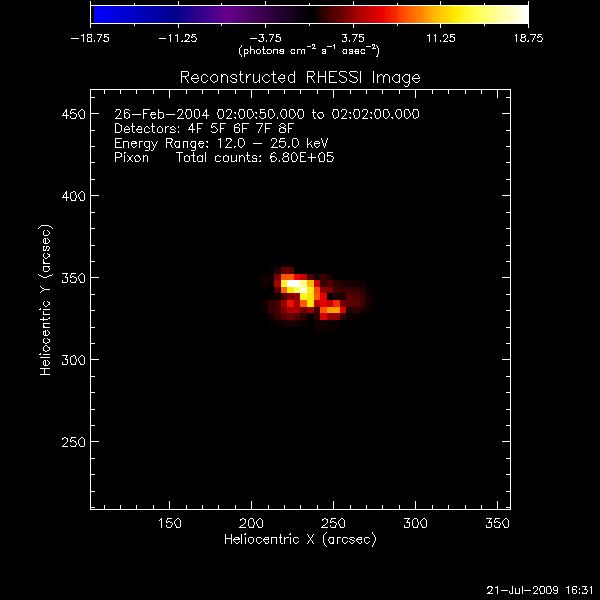

Time:2:03:07-2:06:00
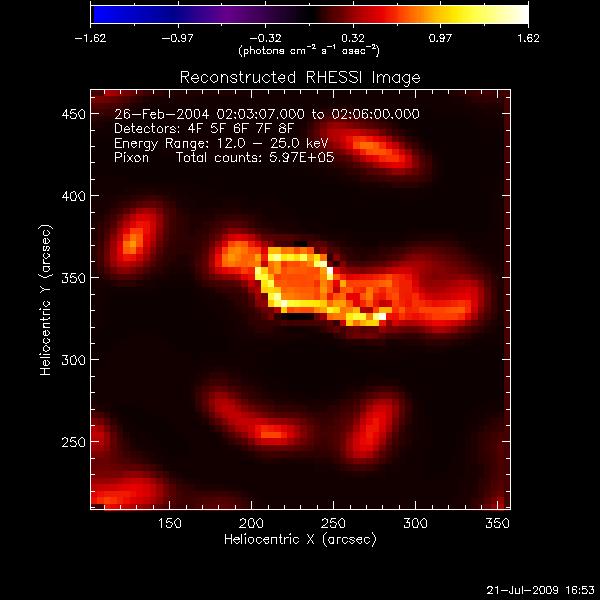
July 22, 2009
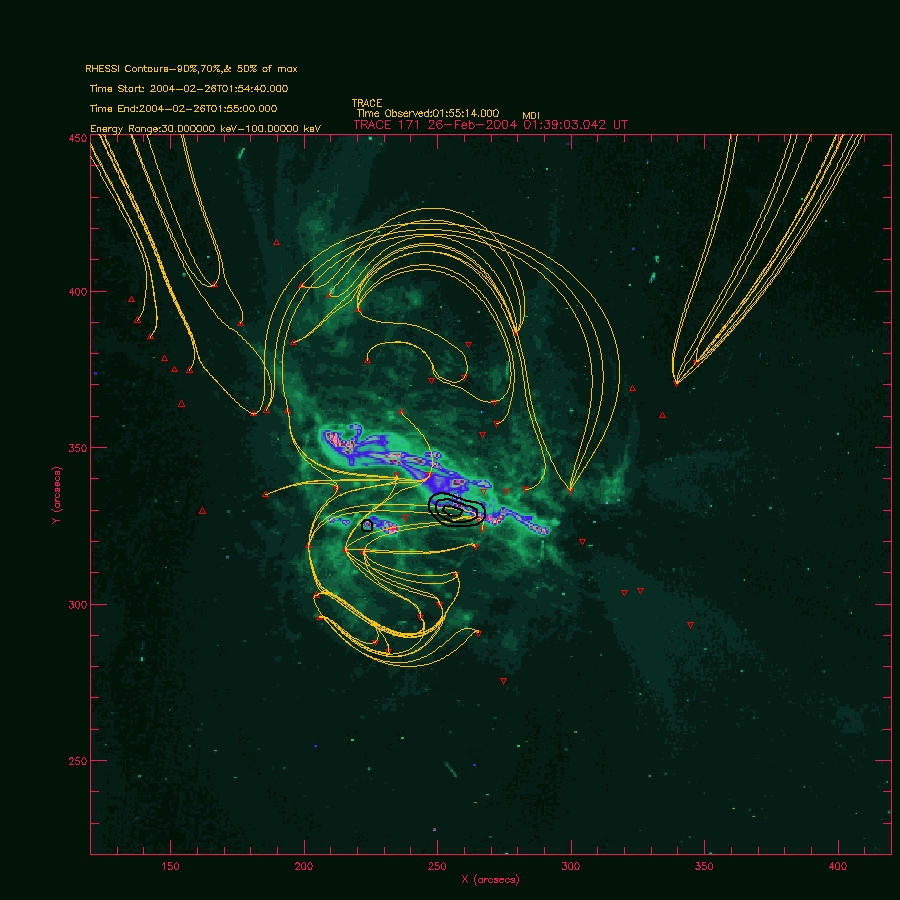
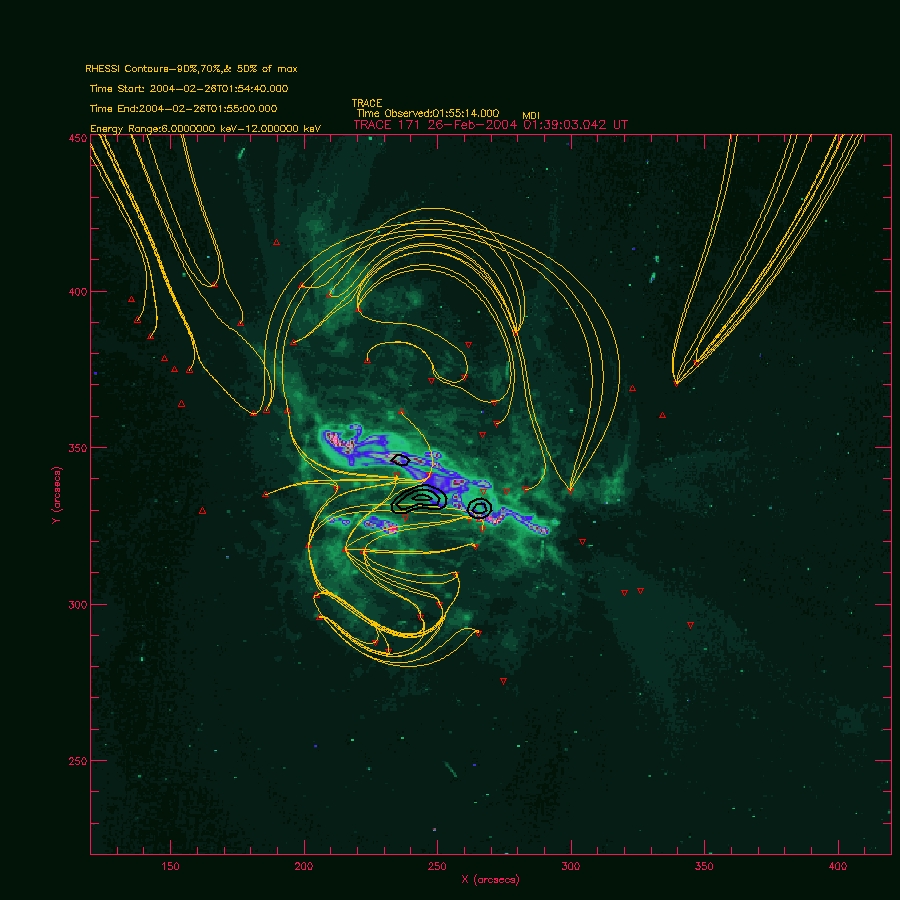
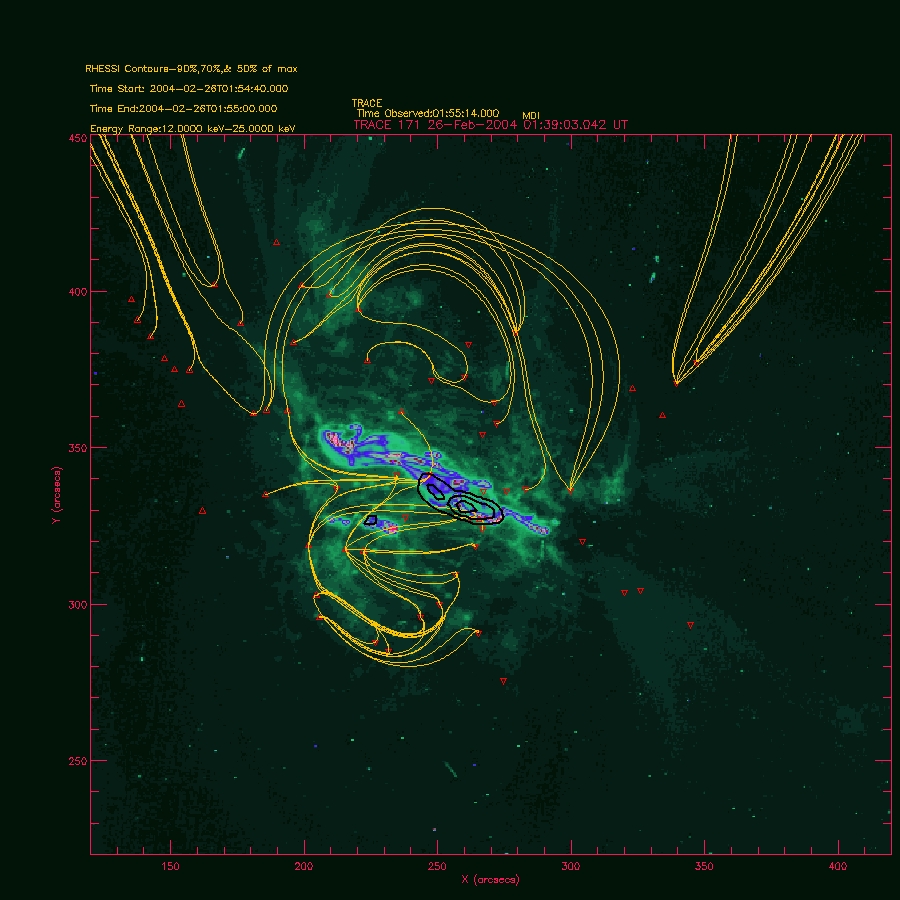
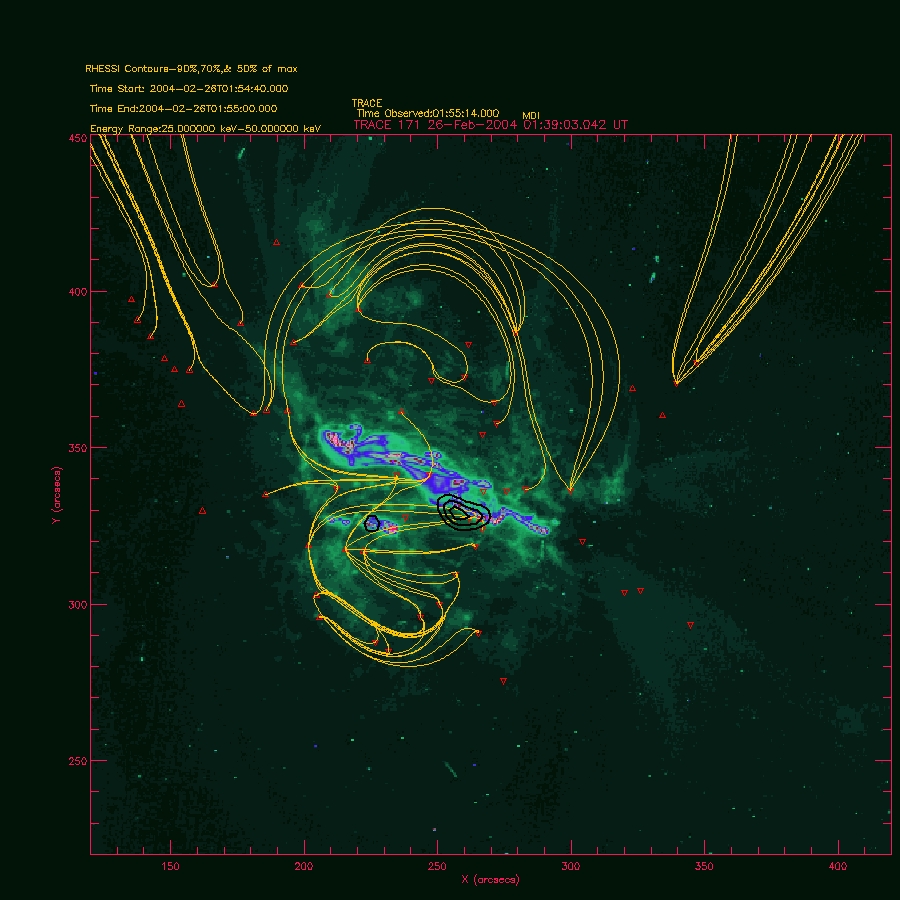
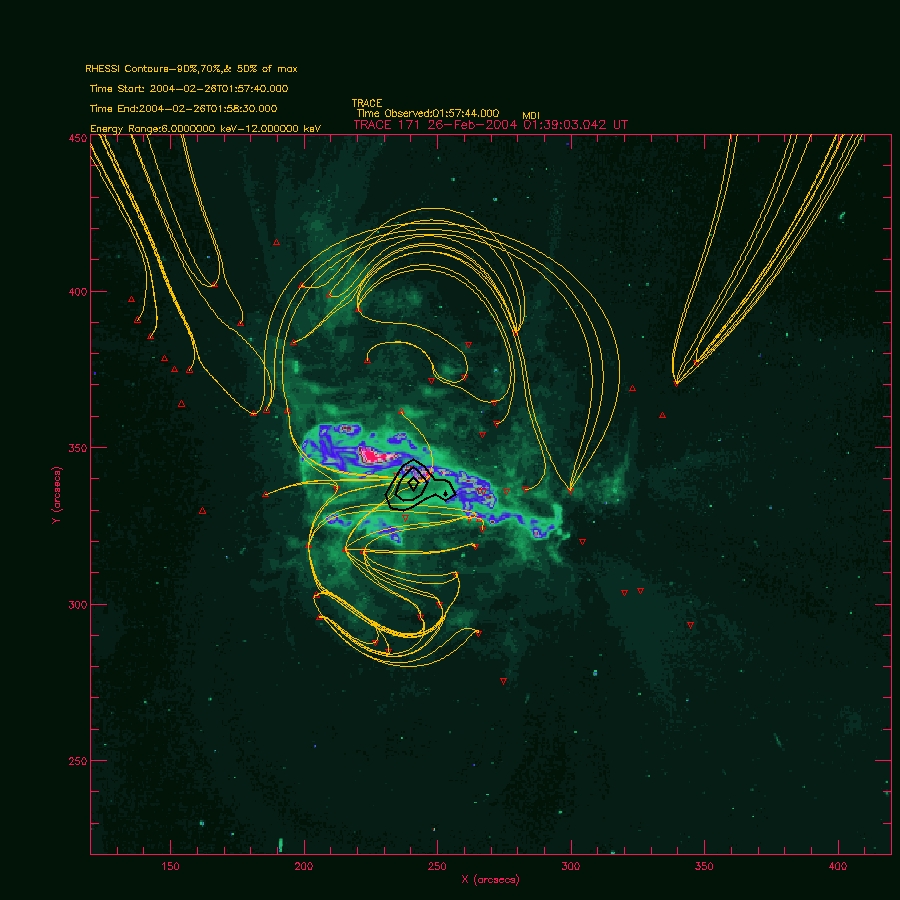
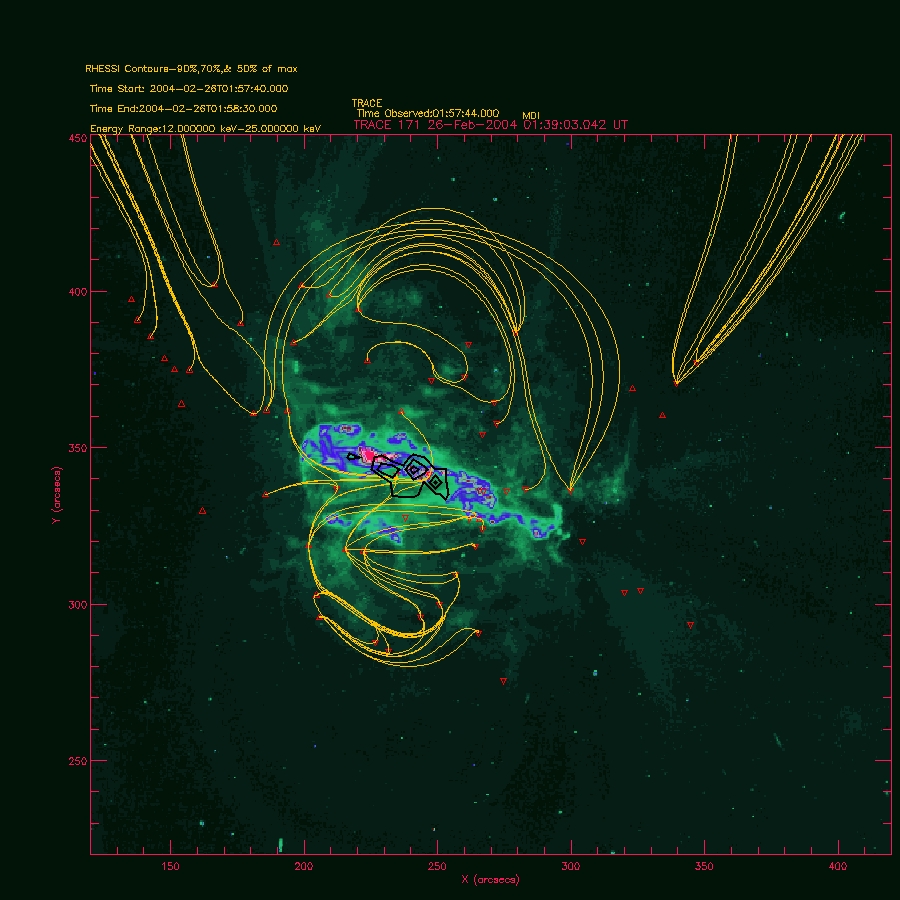
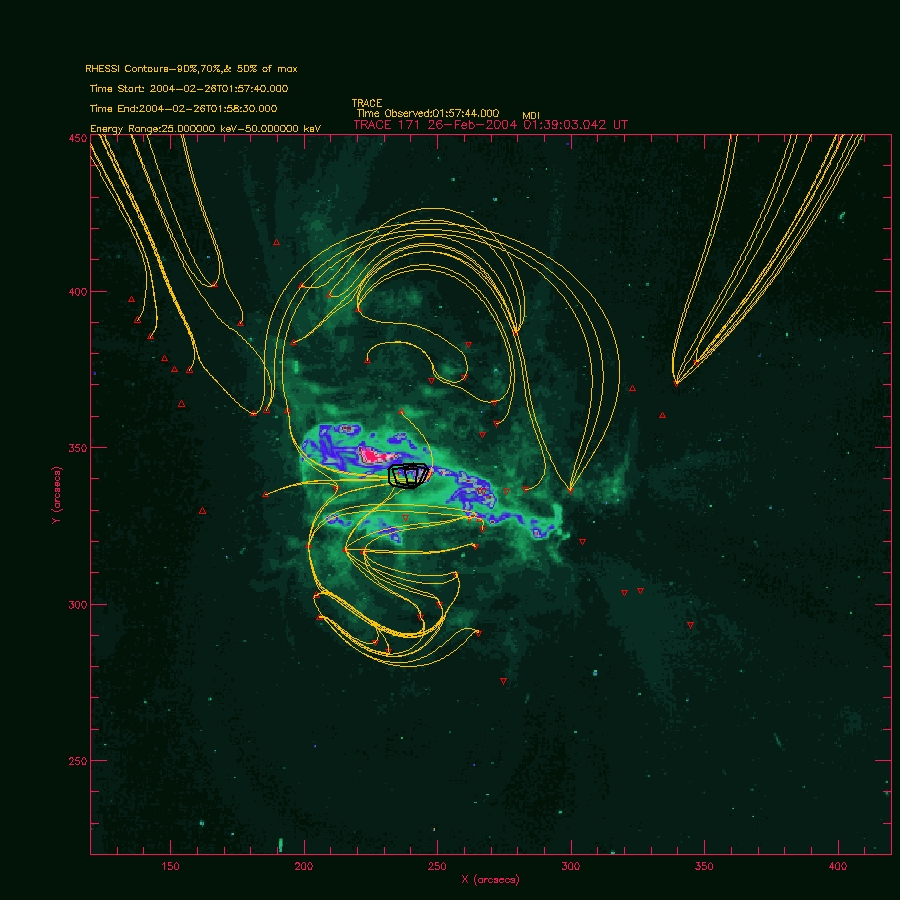
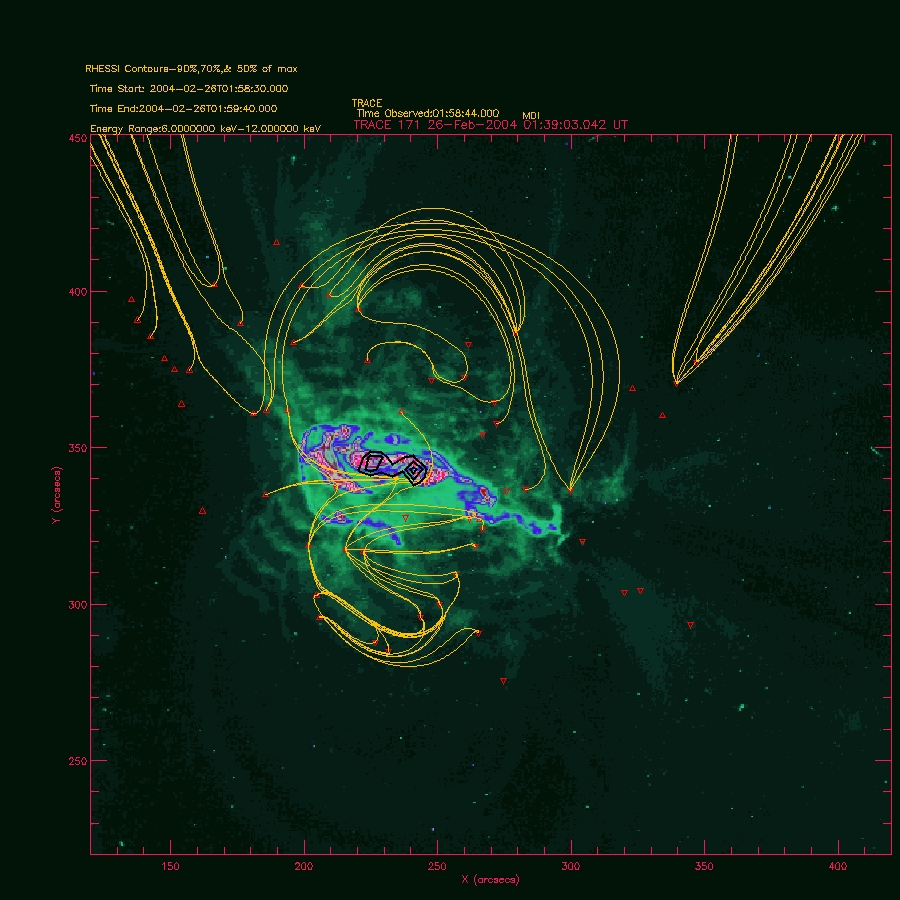
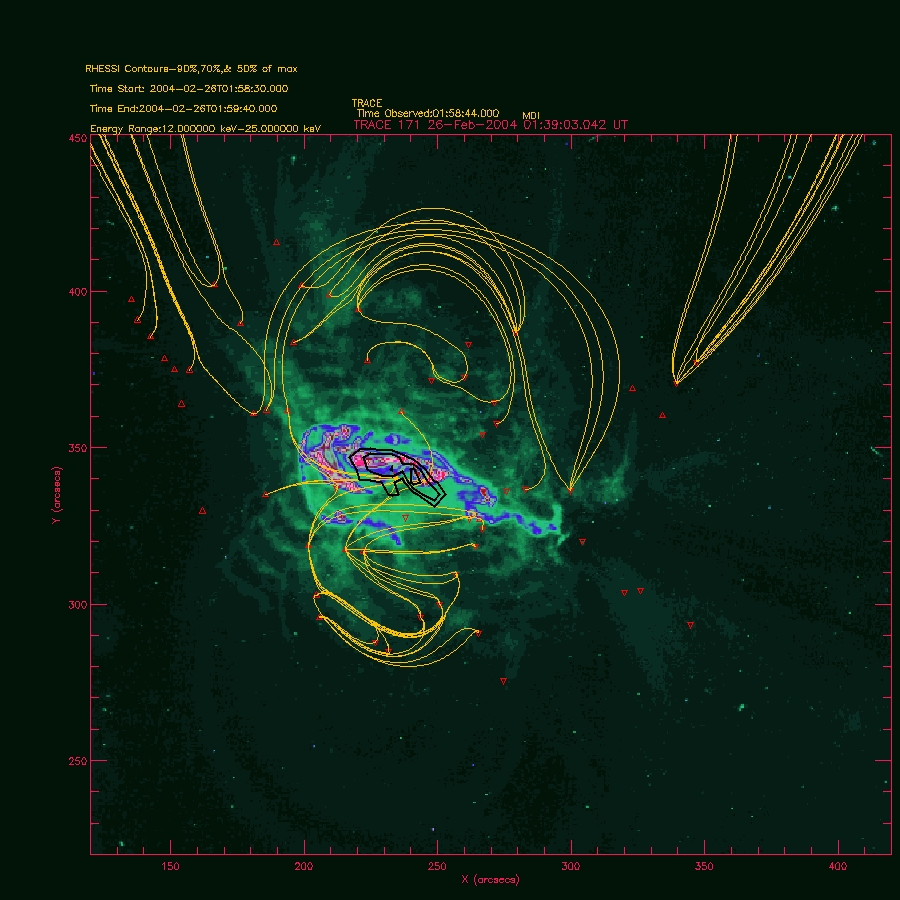
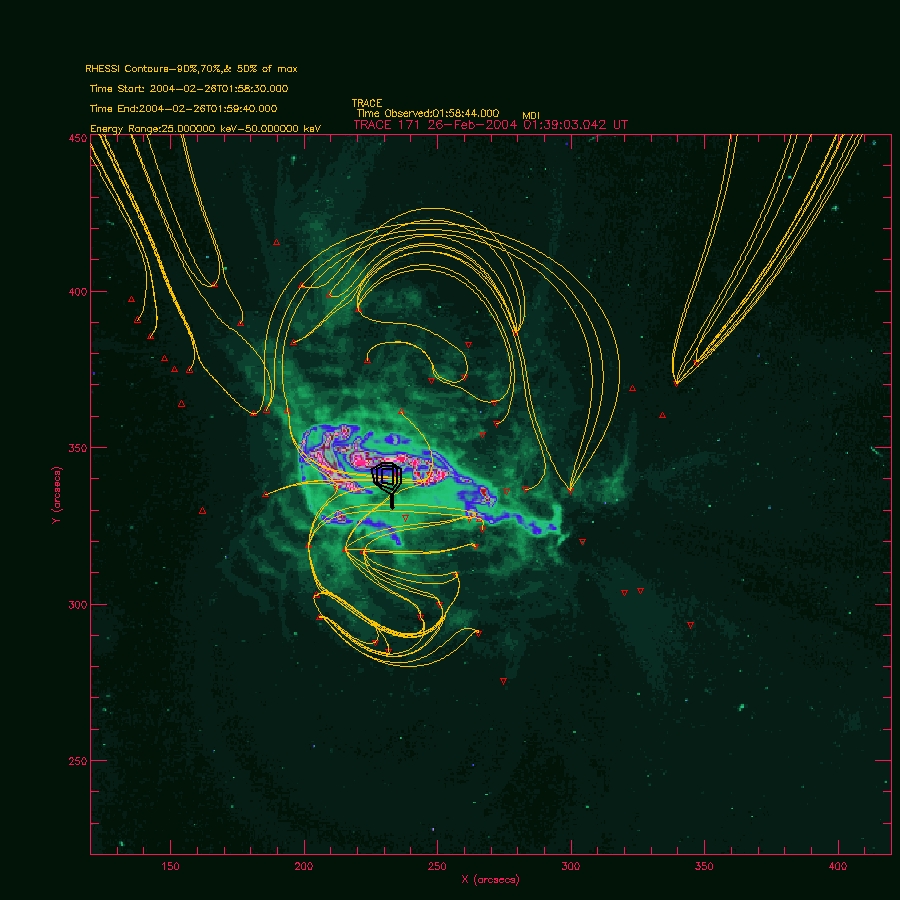
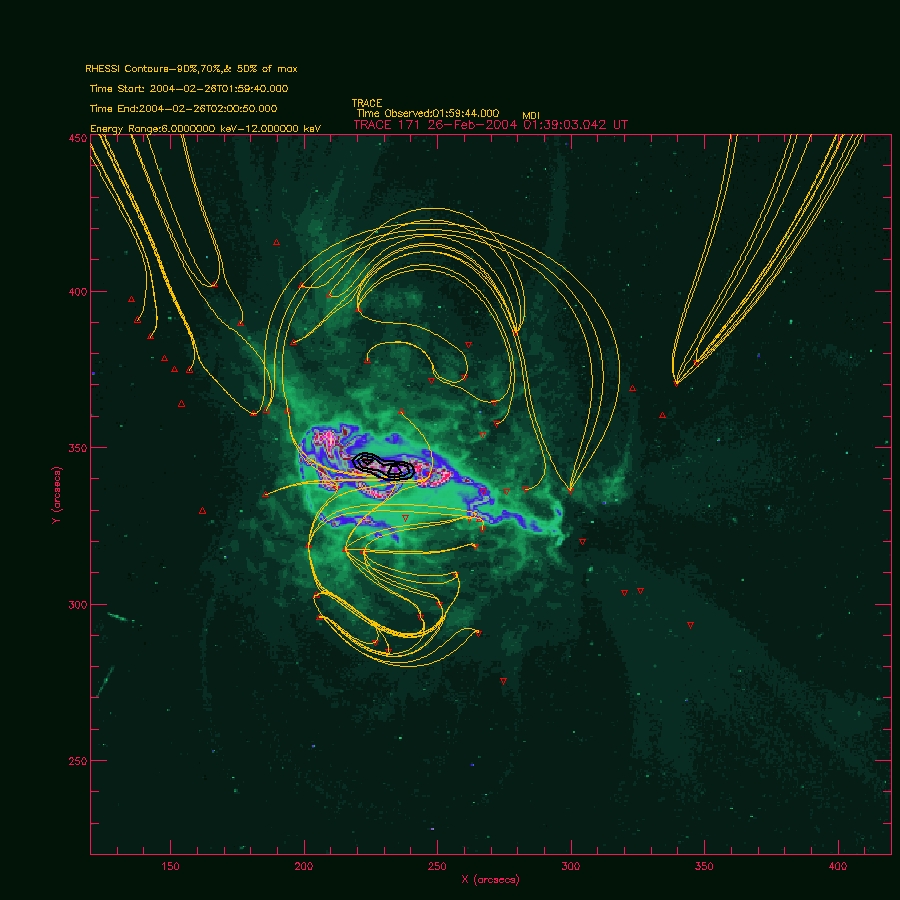
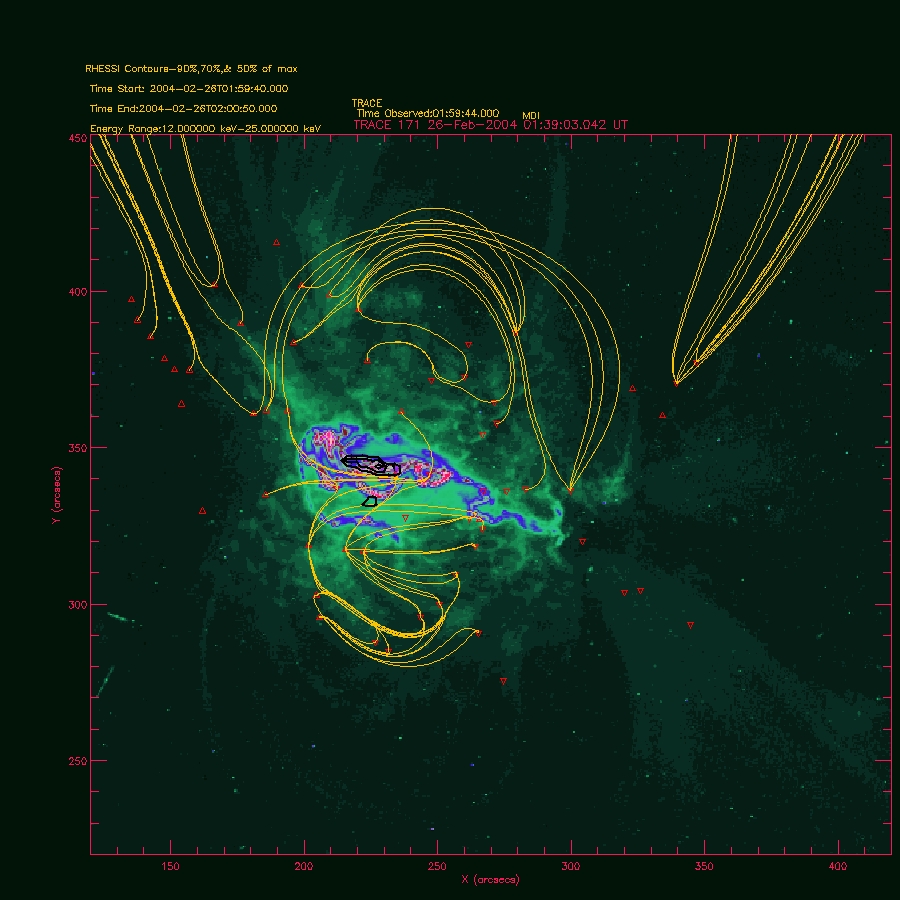
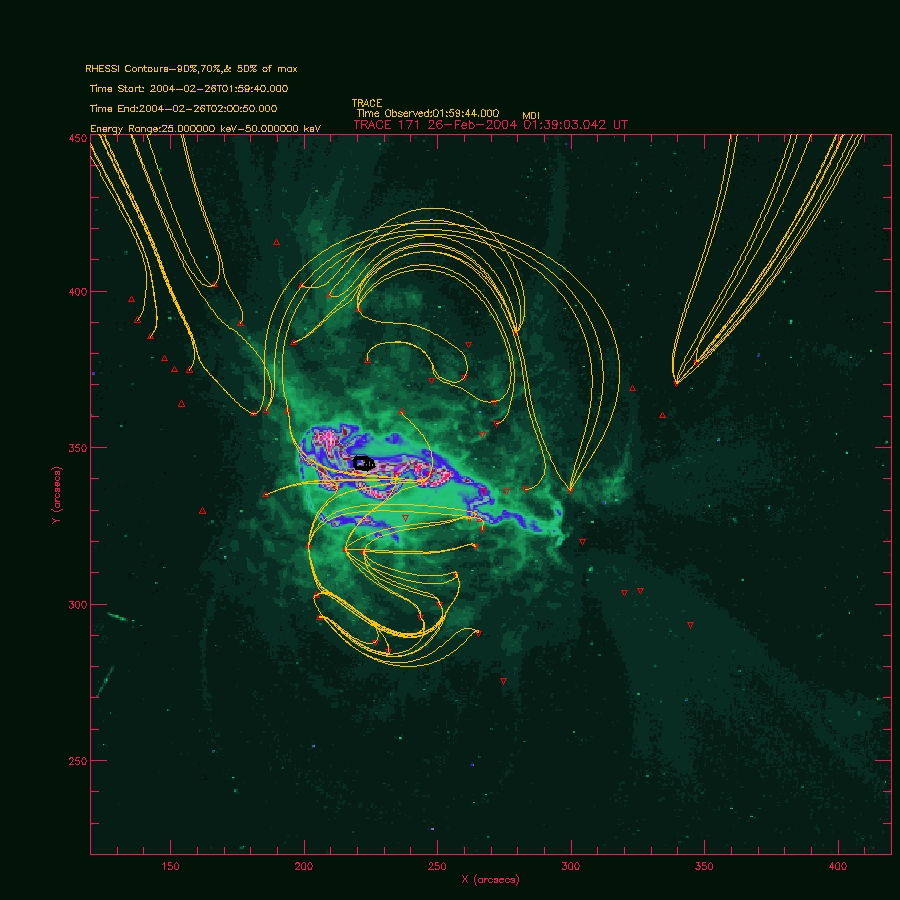
Same topology and RHESSI Contours but different time from TRACE.
TRACE Time: 2:01:14 TRACE Time: 2:01:44
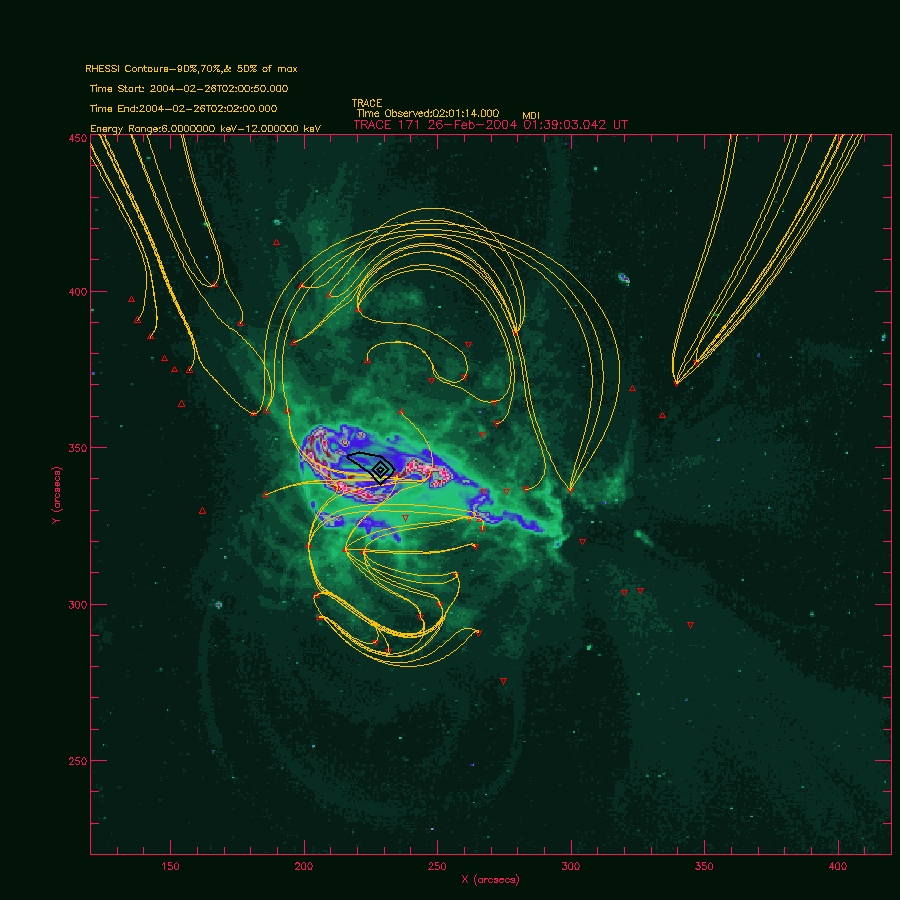
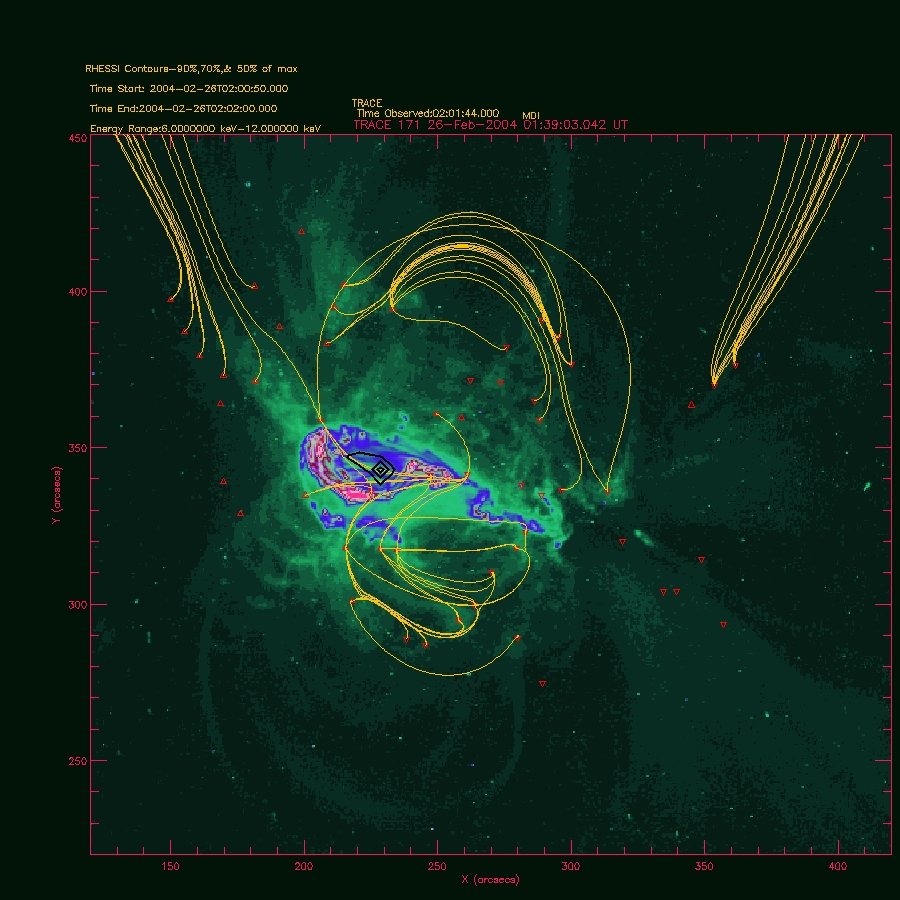
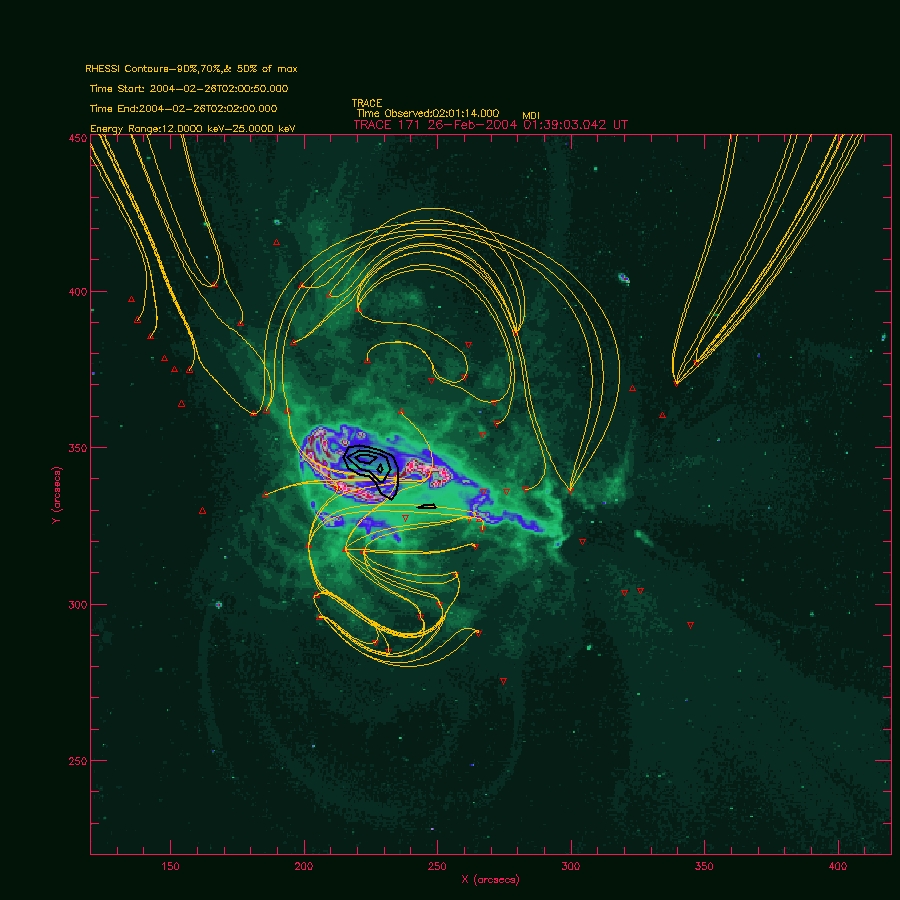
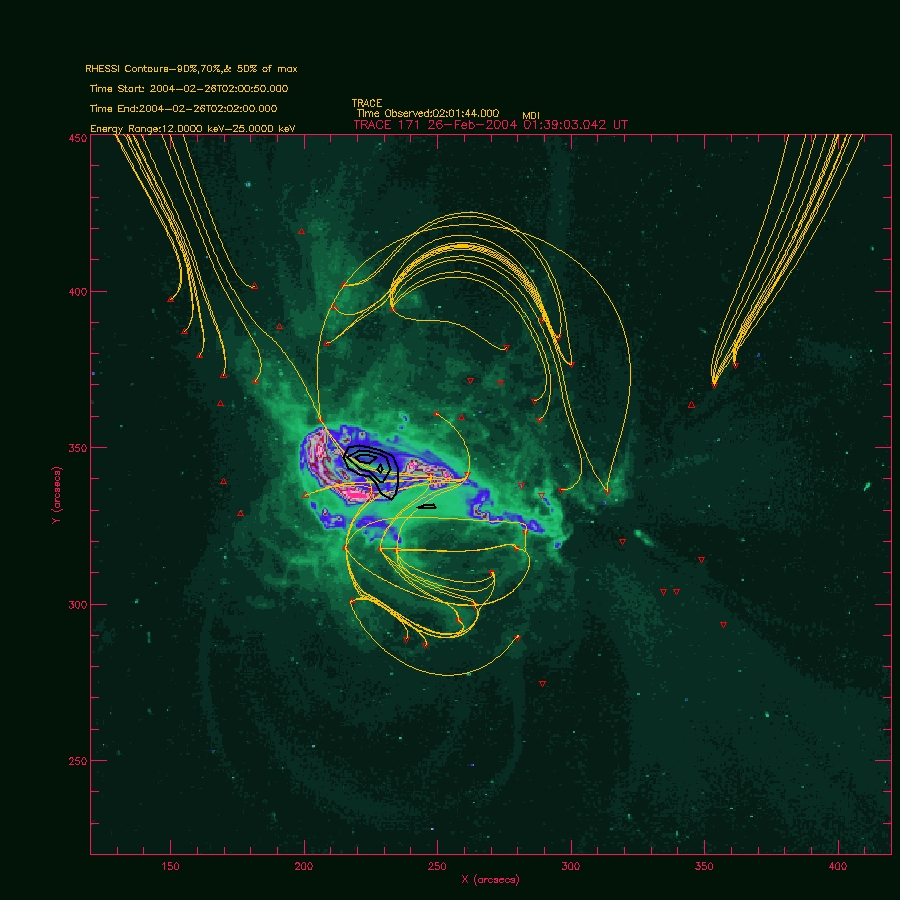
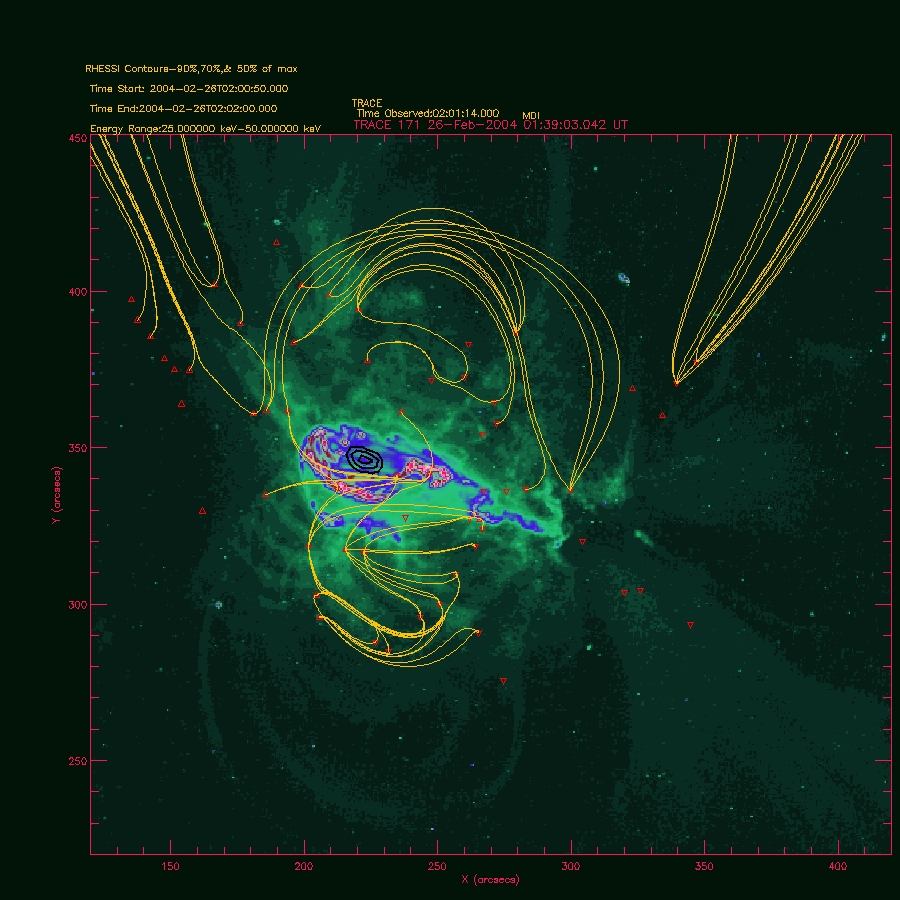
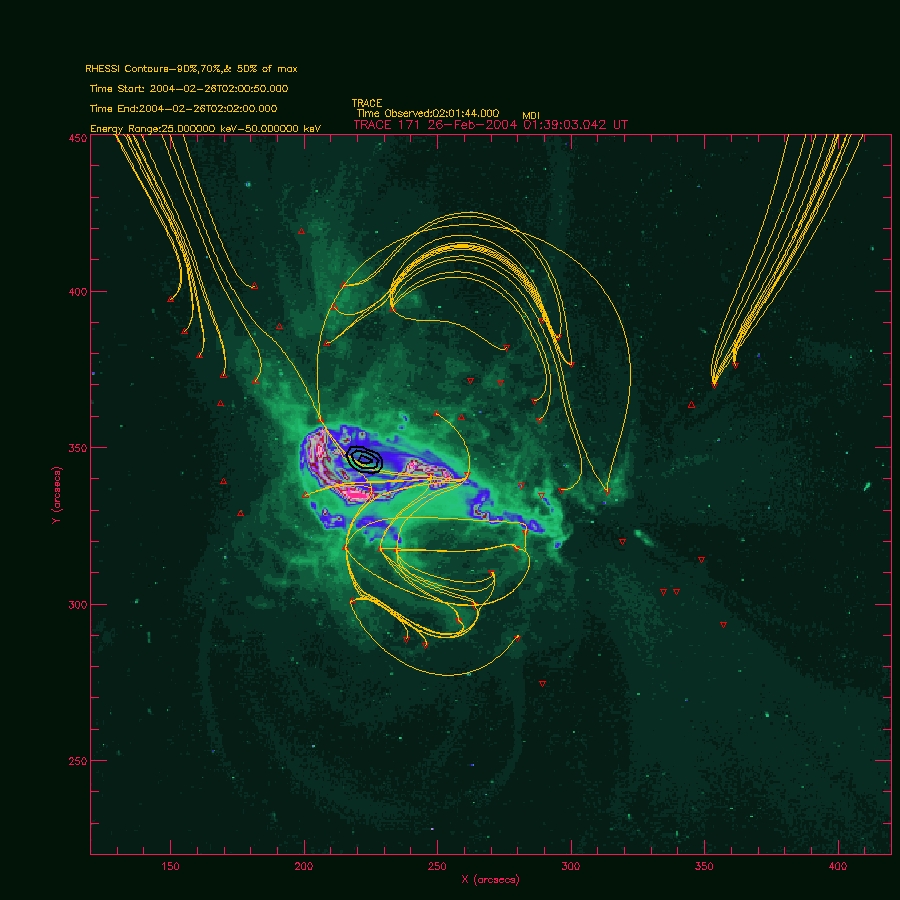
TRACE Time: 2:03:14 TRACE Time: 2:05:47
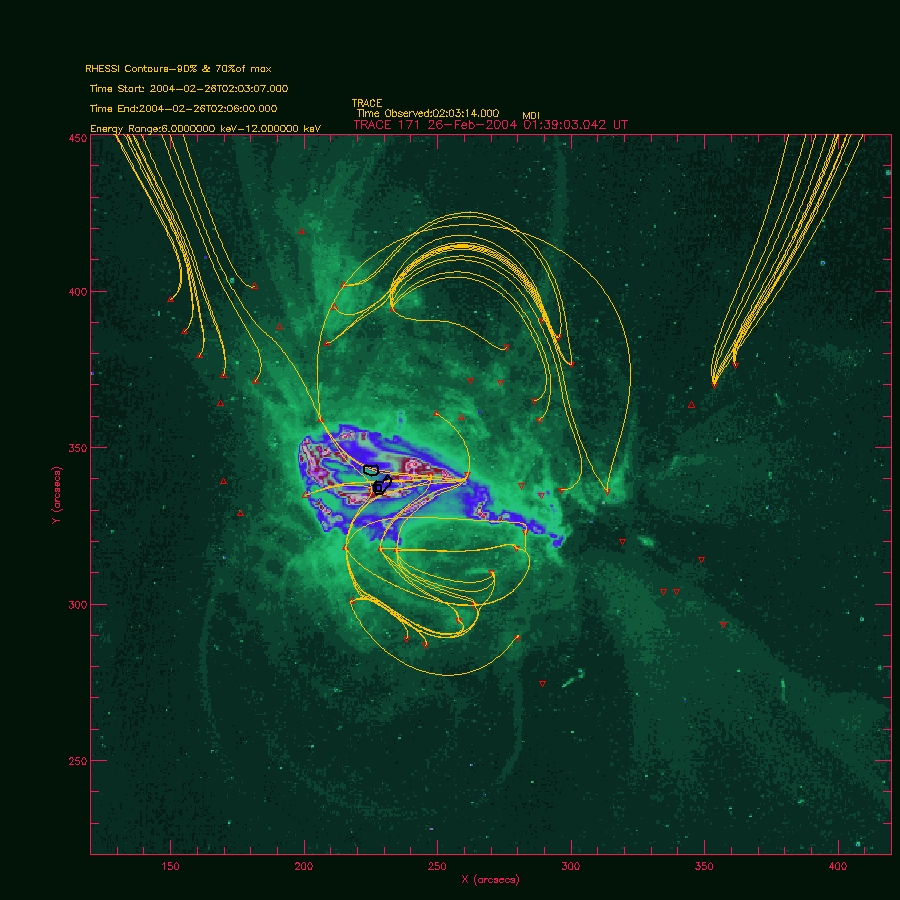
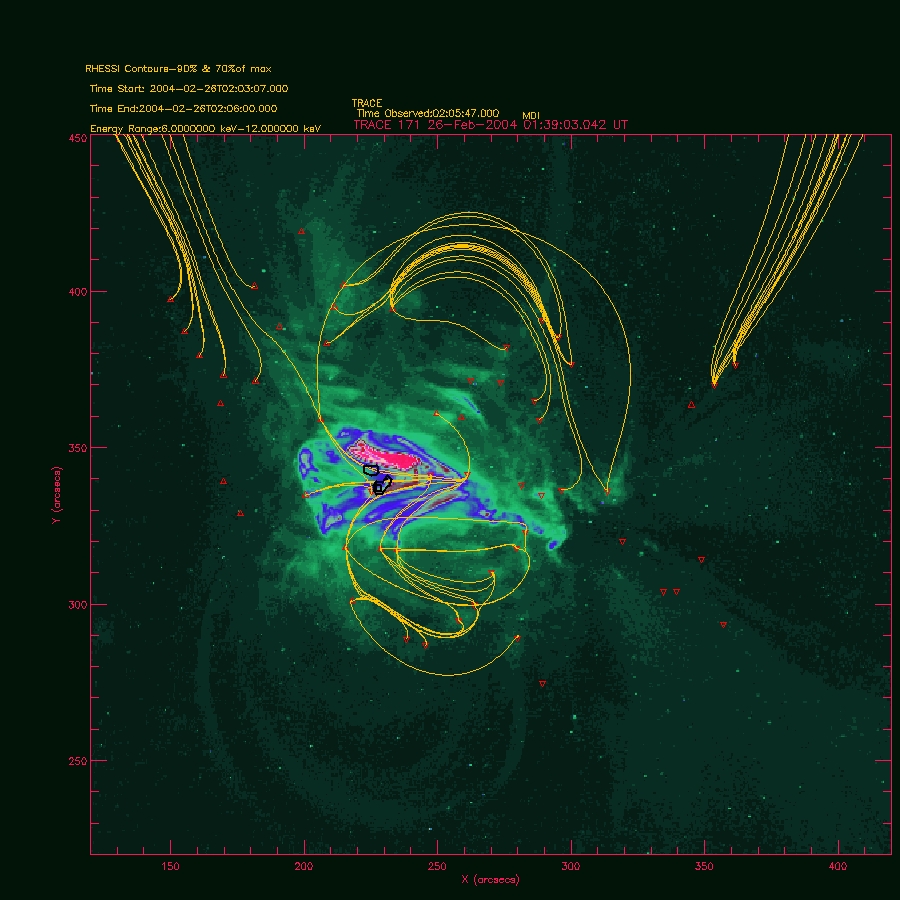
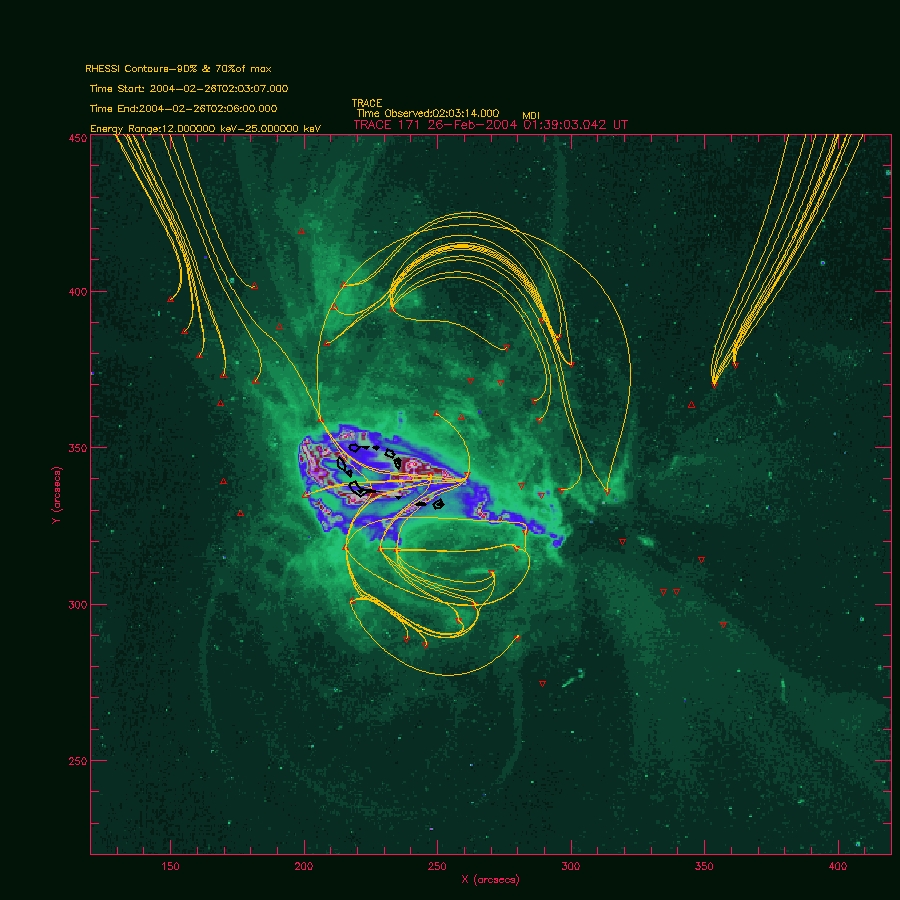
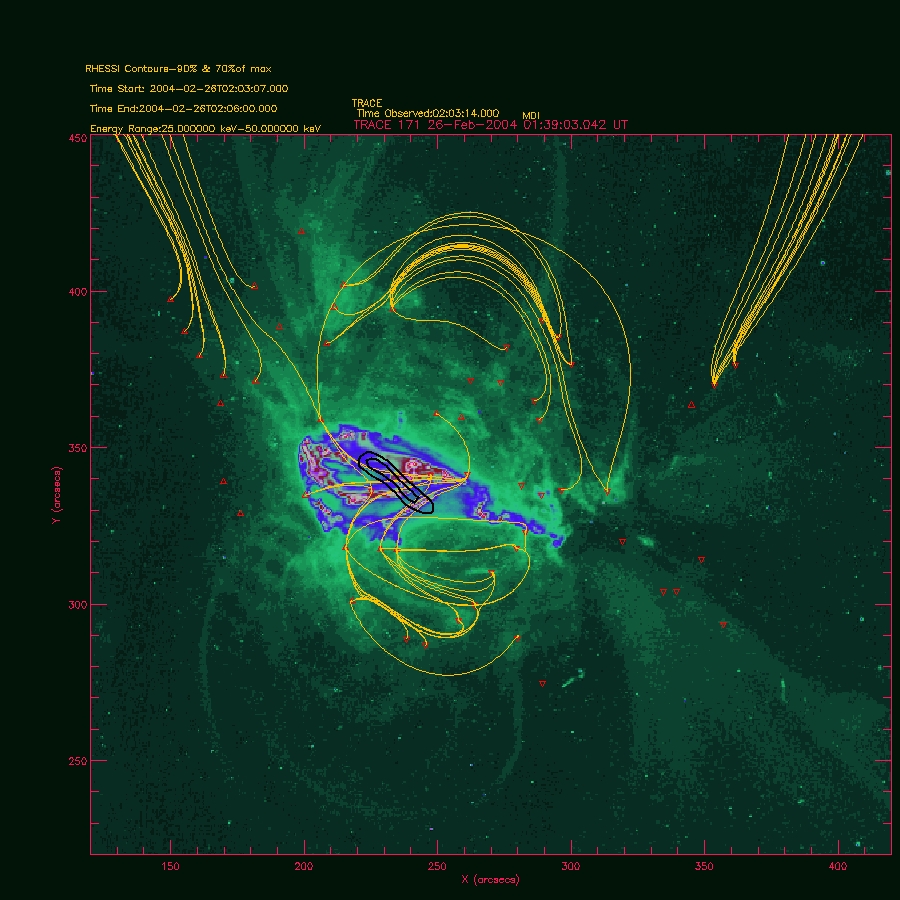
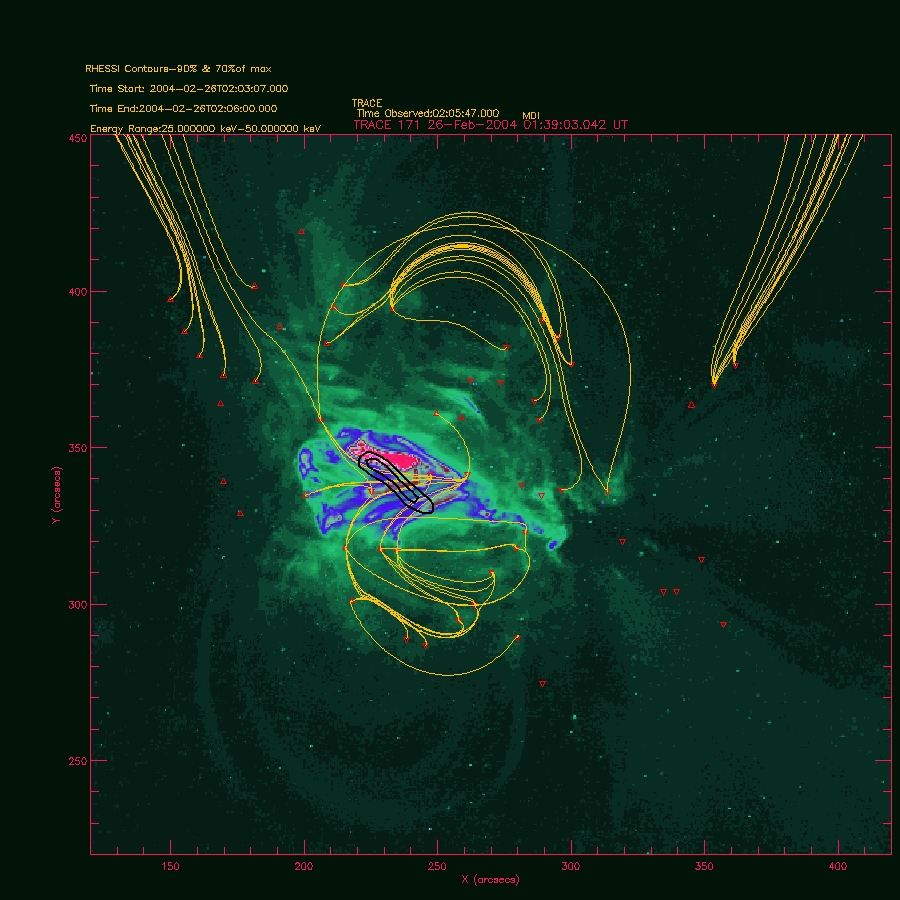
I noticed that when I overlayed the RHESSI contours over different TRACE times the positioned slightly changed. I thought if I made several movies for each individual energy interval, I would see the RHESSI contours change in position with respect to TRACE time.
Movies
TRACE 6-12 keV
TRACE 12-25 keV
TRACE 25-50 keV
TRACE 171
After reviewing yesterdays work with Angela we found some errors I need to correct.
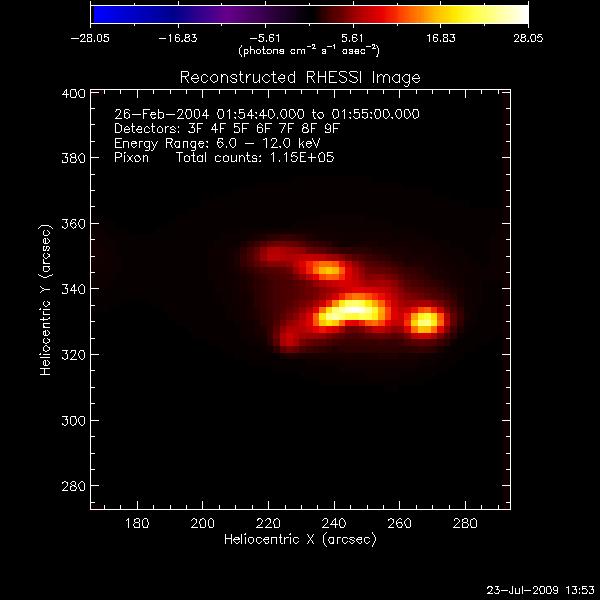
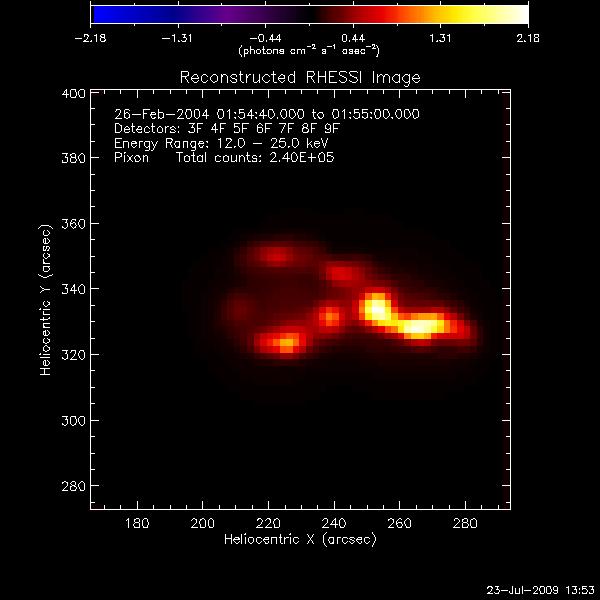
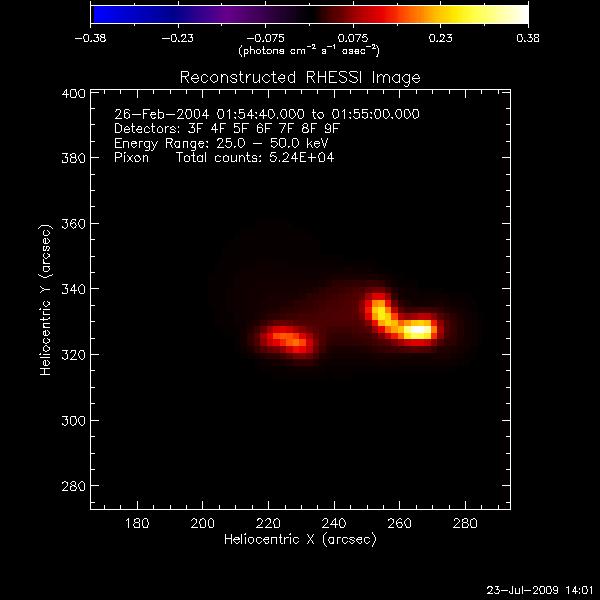
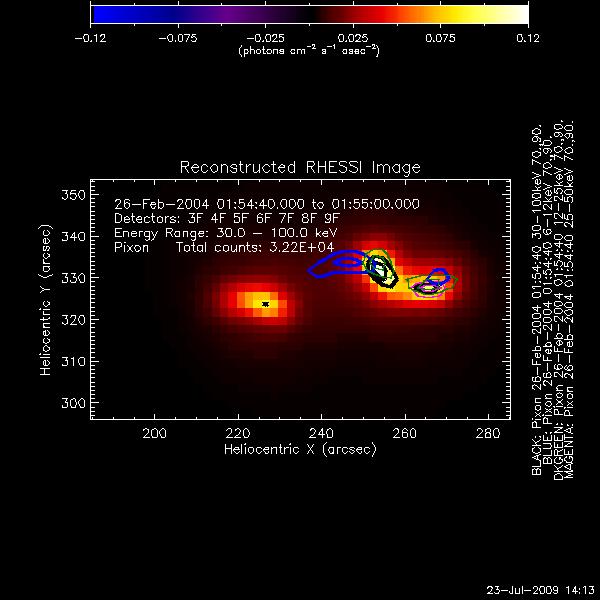
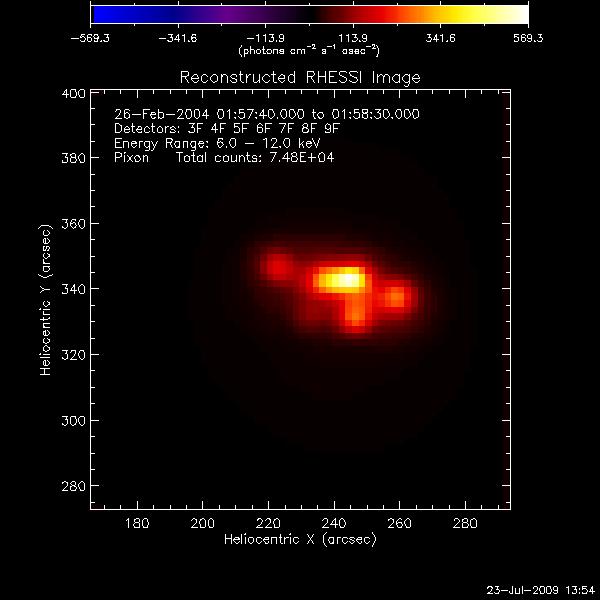
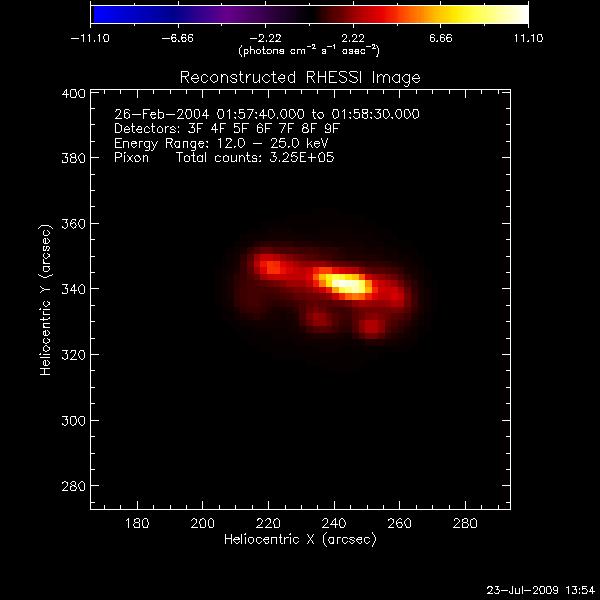
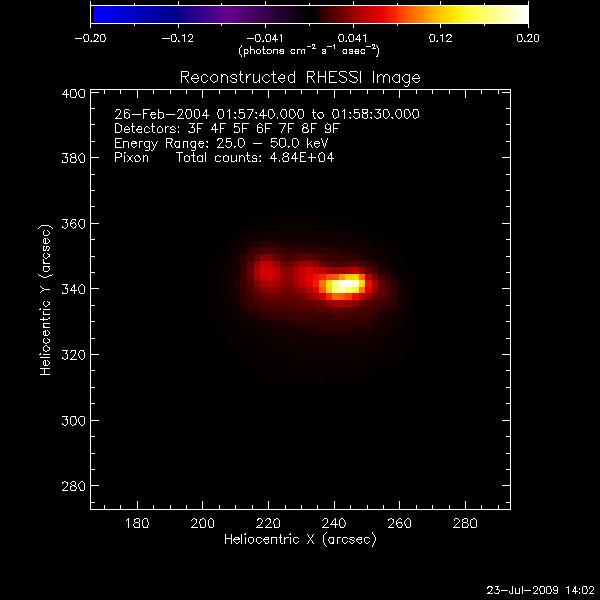
-I was able to make RHESSI images with detectors 3-9.
From there I'm remaking all of the TRACE overlays using the new fits files from the pixon images.
-Make new movies
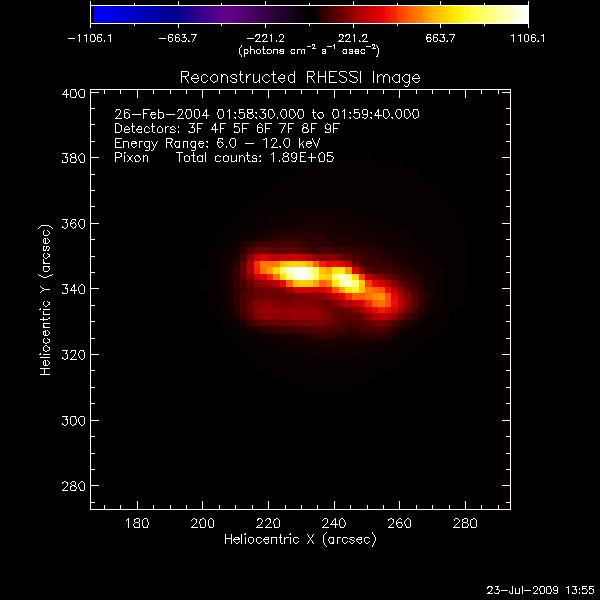
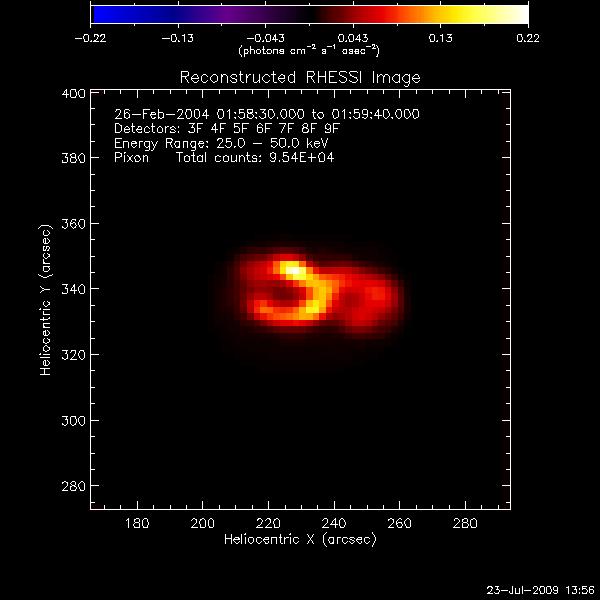
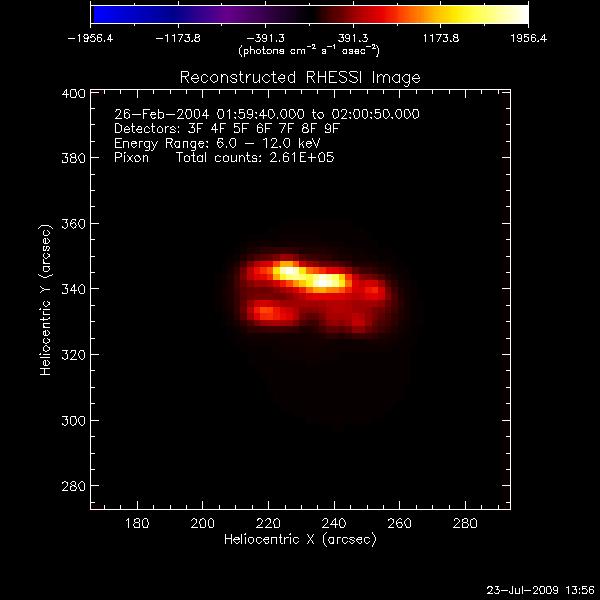
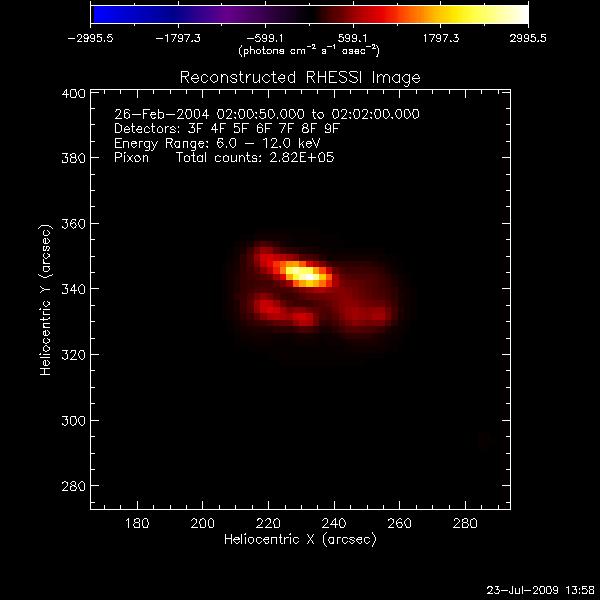
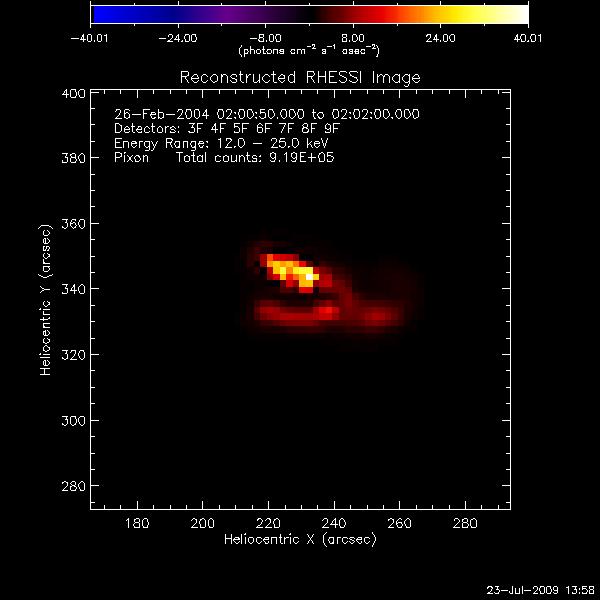
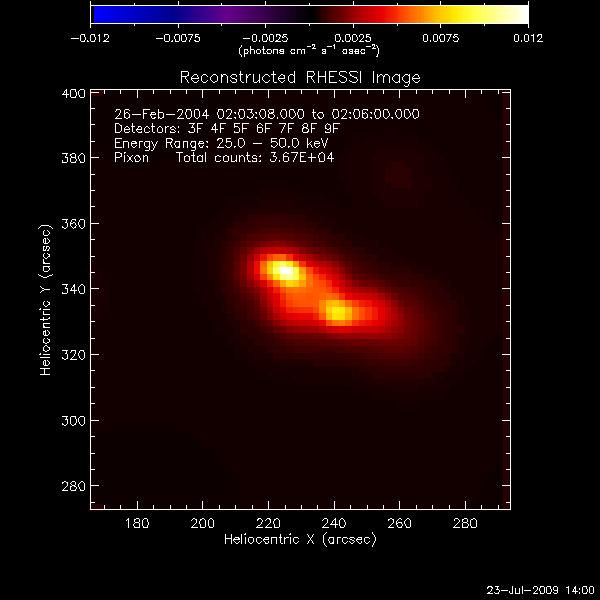
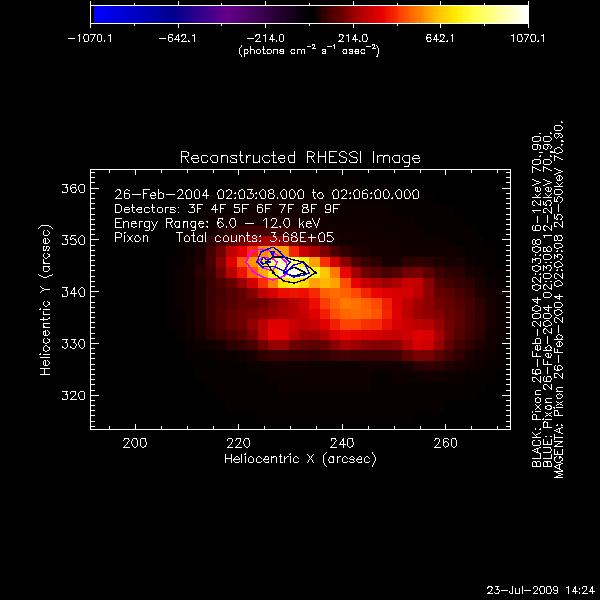
New and Final RHESSI Pixon Images
Time: 1:54:40-1:55:00
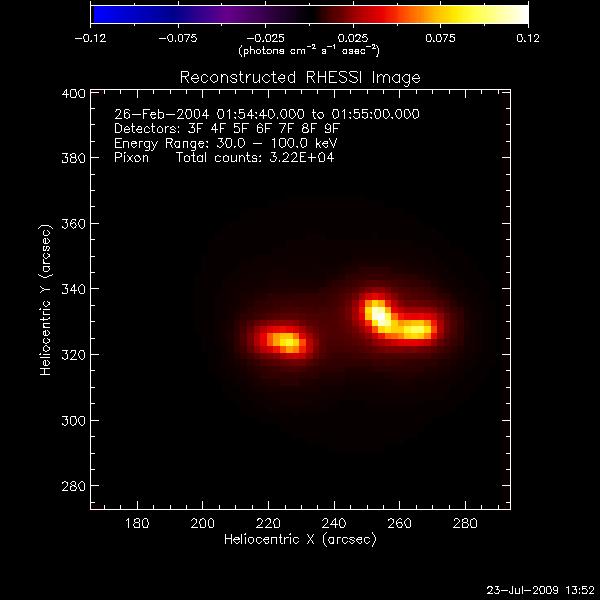
Time 1:57:40-1:58:30
Time: 1:58:30-1:59:40

Time: 1:59:40-2:00:50
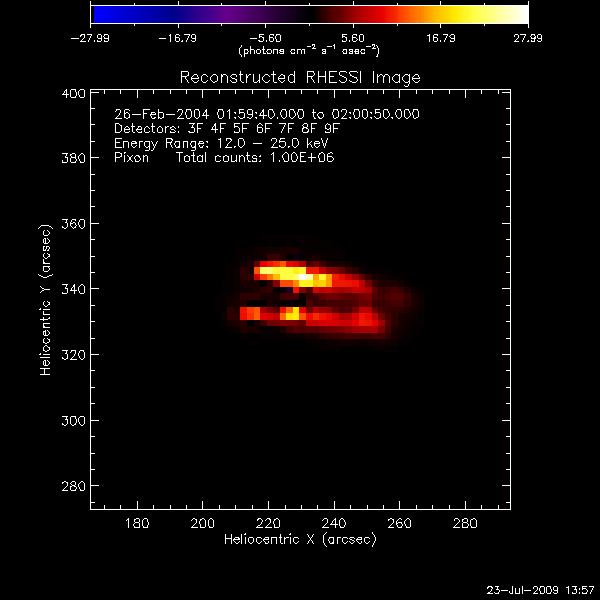

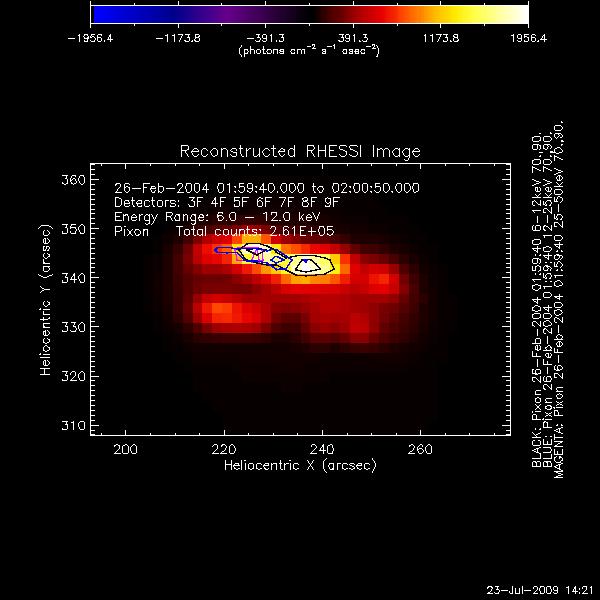
Time: 2:00:50-2:02:00
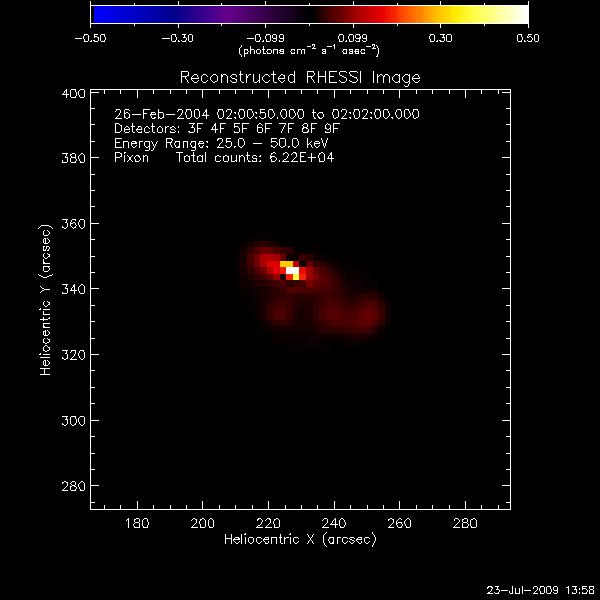
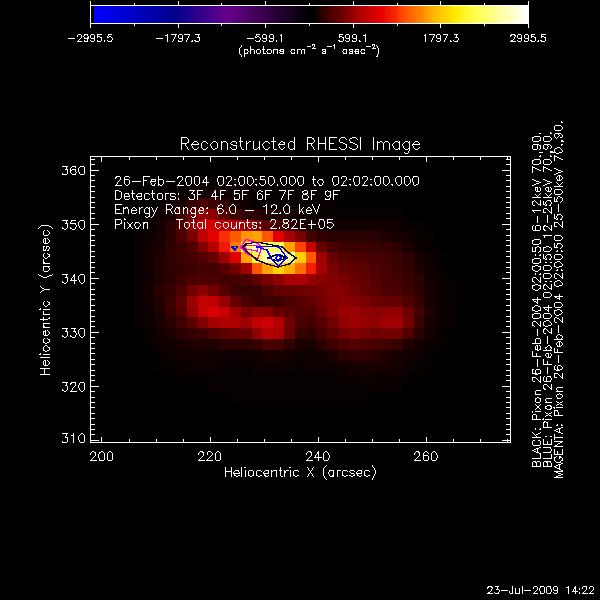
Time: 2:03:08-2:06:00
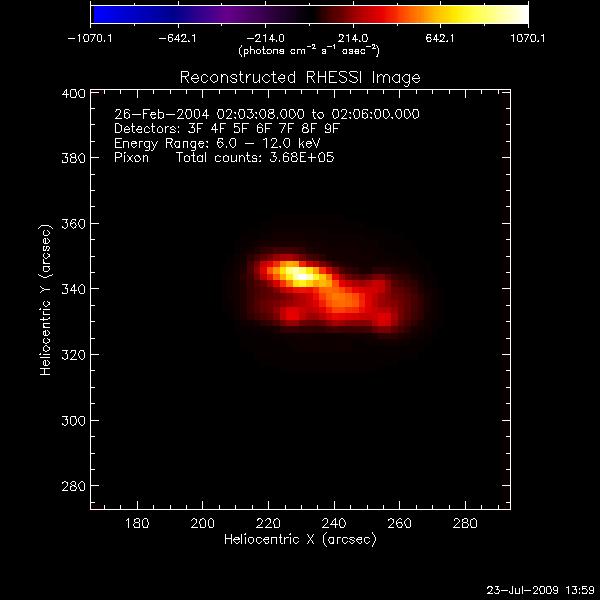
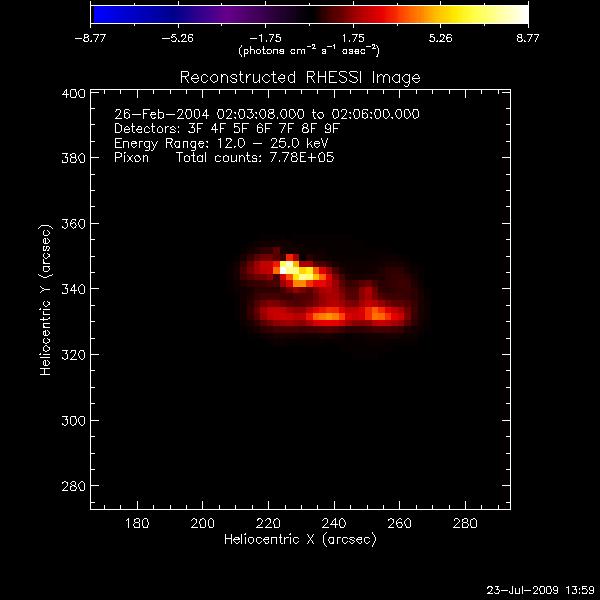
New TRACE overlay movies:
TRACE 171 6-12 keV
TRACE 171 12-25 keV
TRACE 171 25-50 keV
TRACE 171 6-50 keV
