1) Generate a random array of flux
2) From this, generate a normally distributed array of flux
3) Calculate the first two moments (the mean and the standard deviation, as far as I understand)
4) Check that these moments are theoretically correct
5) Plot a histogram of this array of flux
After a somewhat extensive (although i'm sure in a few weeks time i'll laugh at that descriptor) period of fiddling around with IDL, Silvina and I came to the conclusion that generating a random array of flux and then converting this to a normal distribution was not as efficient as using the rather nifty tool on IDL that generates normally distributed gaussians, with a mean of 0 and standard deviation of 1.
So, here is a randomly generated 3000x3000 array with a normal distribution
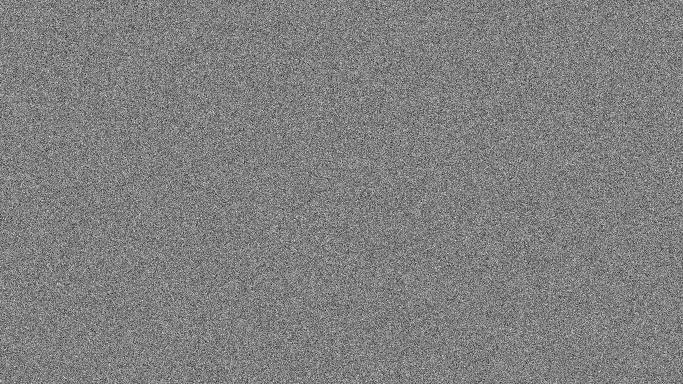
Since the point of the whole exercise was to learn IDL, I than ran a couple of for lops to determine the mean and standard deviation of this array. Lo and behold, the mean was roughly zero and the standard deviation was roughly 1. Good job normally distributed random number generator.
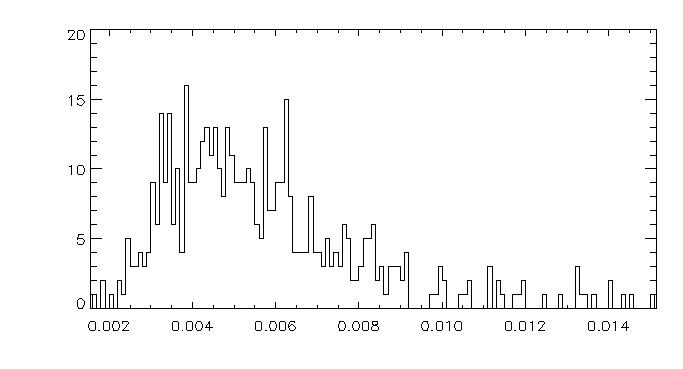
So with that done, all that is left is to plot the histogram of this array of flux. Since there is a reasonably large number of elements (9 million to be exact - don't accidentally tell IDL to print an array like this) I thought a relatively small bin size would be appropriate.
Here is my beautiful gaussian curve in histogram form. A bin is just a certain predefined interval, and the plot is the result of counting how many elements of the array fall into that specific interval.
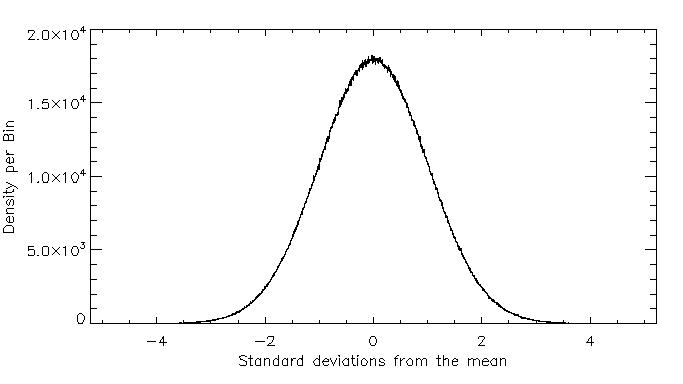
This task might seem a bit contrived but a common assumption in solar physics is that on a magnetogram, the flux is distributed like a gaussian. So this task should prove to be quite a useful one in the long run.
So that was last week. Met with my advisor, Dana Longcope, today to get an overview of what i'm supposed to be doing for the rest of the 10 weeks i'm here. Had quite a lengthy discussion about magnetic null point densities and various tricks to make calculating them possible. I might be wrong, but I think i'm going to be trying to find a null point density that takes freqency of waves propagating through the magnetic field into account. Below a certain cutoff frequency, null points reflect certain waves. My head is still spinning with the effort of trying to take this all in though... Task for now is to try and understand how gaussians behave in general and a paper Dana wrote from 2003 about calculating null point densities.
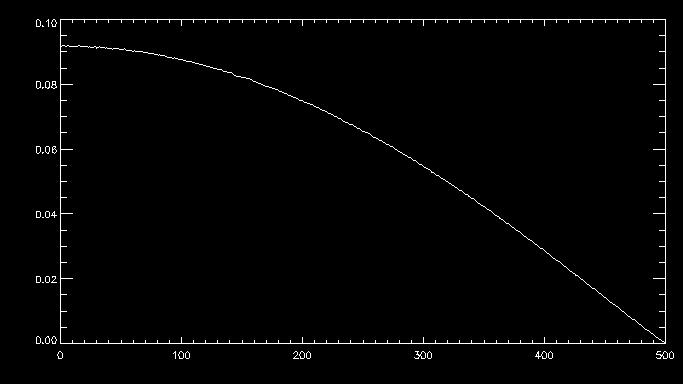
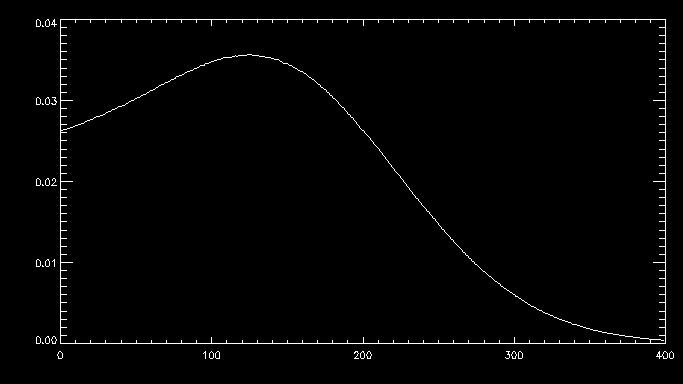


 + (1-c^2)[sqrt2n_2n_3n_4 + \frac{1}{sqrt2}(n_3^2-n_4^2)n_1]|\rangle](http://www.texify.com/img/%5CLARGE%5C%21G%28%5Czeta%2Cc%29%20%3D%20%5Cfrac%7Be%5E%7B%5Cfrac%7B-%5Czeta%5E2%7D%7B2%7D%7D%7D%7Bsqrt2%5Cpi%5E%7B%5Cfrac%7B3%7D%7B2%7D%7D%7D%7B%5Clangle%5Cfrac%7B1%7D%7B4%7D%7C%28sqrt%7B1-c%5E2%7Dn_5%20%2B%20c%5Czeta%29%5E3%20%2B%20%5B%281-c%5E2%29%28n_3%5E2%2Bn_4%5E2%29%20-%20%5Cfrac%7B1%7D%7B2%7D%28n_1%5E2%20%2B%20n_2%5E2%29%5D%28sqrt%7B1-c%5E2%7Dn_5%20%2B%20c%5Czeta%29%20%2B%20%281-c%5E2%29%5Bsqrt2n_2n_3n_4%20%2B%20%5Cfrac%7B1%7D%7Bsqrt2%7D%28n_3%5E2-n_4%5E2%29n_1%5D%7C%5Crangle.gif)
 and
and  we can calculate
.jpg)
![W_{cutoff} = \sqrt[3]{det(M_o)}\rho^{-\frac{1}{2}} e^{\frac{z}{2H_o}}](http://www.texify.com/img/%5CLARGE%5C%21W_%7Bcutoff%7D%20%3D%20%5Csqrt%5B3%5D%7Bdet%28M_o%29%7D%5Crho%5E%7B-%5Cfrac%7B1%7D%7B2%7D%7D%20e%5E%7B%5Cfrac%7Bz%7D%7B2H_o%7D%7D.gif)
 + (1-c^2)[sqrt2n_2n_3n_4 + \frac{1}{sqrt2}(n_3^2-n_4^2)n_1]|\rangle\Theta(det{Mo} - W_{null})](http://www.texify.com/img/%5CLARGE%5C%21G%28%5Czeta%2Cc%29%20%3D%20%5Cfrac%7Be%5E%7B%5Cfrac%7B-%5Czeta%5E2%7D%7B2%7D%7D%7D%7Bsqrt2%5Cpi%5E%7B%5Cfrac%7B3%7D%7B2%7D%7D%7D%7B%5Clangle%5Cfrac%7B1%7D%7B4%7D%7C%28sqrt%7B1-c%5E2%7Dn_5%20%2B%20c%5Czeta%29%5E3%20%2B%20%5B%281-c%5E2%29%28n_3%5E2%2Bn_4%5E2%29%20-%20%5Cfrac%7B1%7D%7B2%7D%28n_1%5E2%20%2B%20n_2%5E2%29%5D%28sqrt%7B1-c%5E2%7Dn_5%20%2B%20c%5Czeta%29%20%2B%20%281-c%5E2%29%5Bsqrt2n_2n_3n_4%20%2B%20%5Cfrac%7B1%7D%7Bsqrt2%7D%28n_3%5E2-n_4%5E2%29n_1%5D%7C%5Crangle%5CTheta%28det%7BMo%7D%20-%20W_%7Bnull%7D%29.gif)
 Since
Since and using a vector identity we can re-arrange this to
 term corresponds to a magnetic pressure force - something we are not interested in.
  term corresponds to a magnetic tension force, providing a restoring force to straighten out field lines, like in an elastic string. This restoring force allows waves to propagate along the field lines. These are Alfven waves.
 . Evidently, as the magnetic field strength tends towards zero, the alfven speed tends towards zero. A separatrix surface is one that acts as the boundary between two topologically distinct areas of the magnetic field. There are two types of magnetic null point which can be described in terms of separatrices. At the intersection of two seperatrices, there will be an X type null point. O type null points occur in the centre of a magnetic island. It has been found that all the alfven wave energy dissipates along the separatrix surfaces.