Week 7
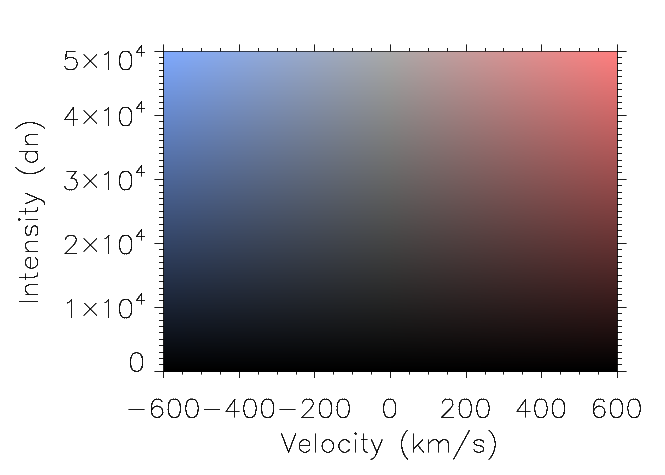
I spent this week trying to make a color table and then plotting the points of the explosive event based on their velocities (redshifted or blueshifted) and intensities. I used much of the first half of the week creating a legend for the image. This is what the legend looks like:
 |
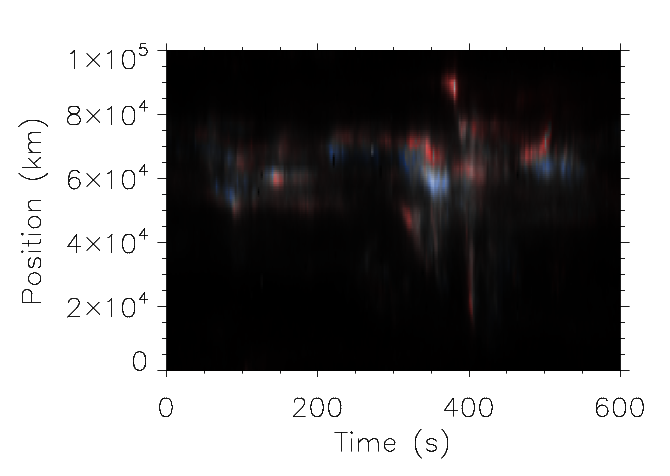
Here is the color image of the explosive event I studied. The blue points have negative velocities and red points have positive velocities. This is what the final image of the explosive event looks like:
 |
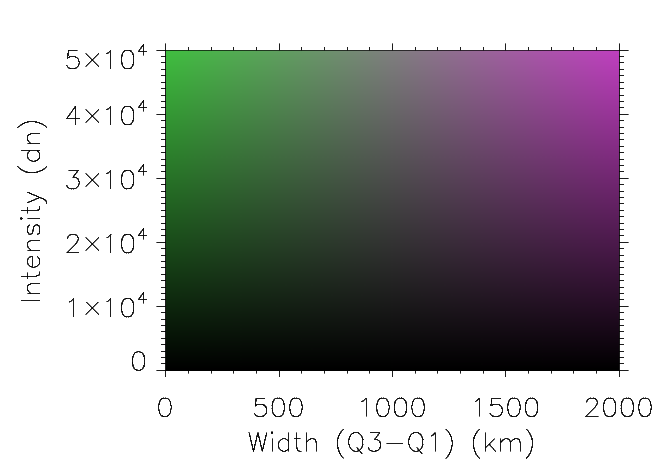
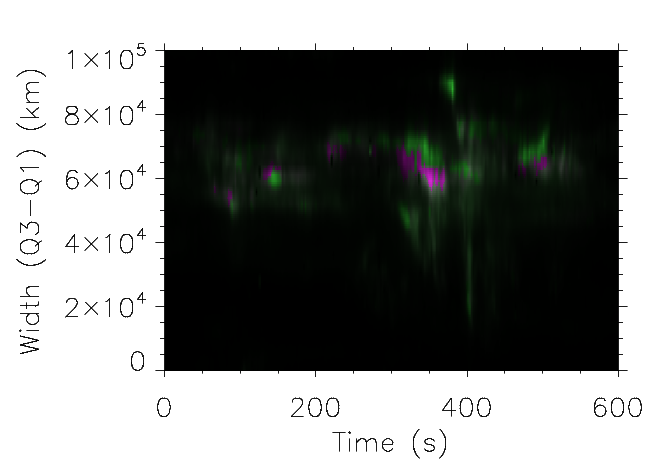
I then made a legend and image in the same way, but plotted the widths of the lines (quartile 3 minus quartile 1) instead. Below are the legend and the explosive event image (still a work in progress when posted).
 |
 |


