Wednesday, June 18, 2014
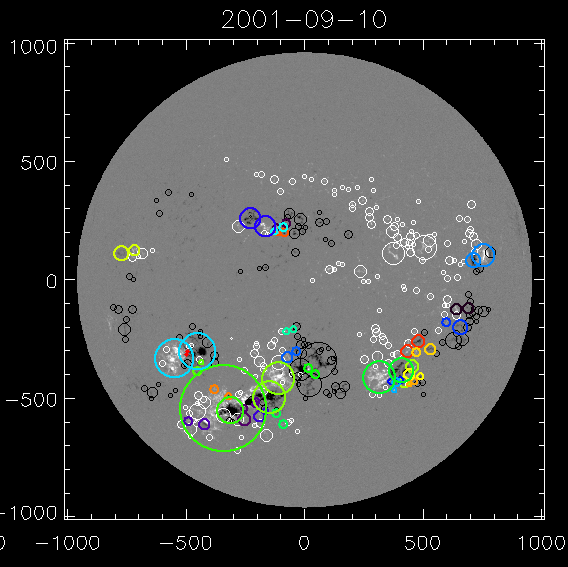
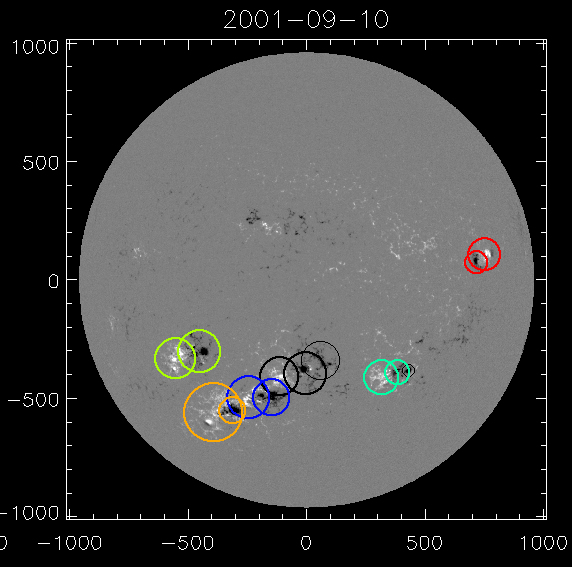
I experimented with a couple new parameters designed to merge adjacent active regions. I tested different combinations of these new parameters on magnetograms taken from the dates selected on Tuesday.
Thursday, June 19, 2014
Today I worked to narrow down on the optimal parameter values for the code. I wrote an IDL script to cycle through 243 different parameter combinations for 5 different magnetograms. I plan to examine these images to determine which combination of parameter values produces the best active region detections.
There was also a lecture on magnetic fields in the Sun (Sarah Jaeggli).
Friday, June 20, 2014
Today I examined the images that I took Thursday and determined the optimal parameter values. I then ran the active regions for the 15 dates I found Tuesday. The results look promising; we are almost ready to run the code on the entire dataset! Here is a link to a compressed file containing the images I examined: Parameter Search (Compressed File)


