Week 9 Log
Monday, August 4, 2014 - Friday, August 8, 2014
In the final week of the program I worked on my final presentation. A pdf version is linked to here. It contains some of the preliminary plots that we have gotten out of the active regions catalog, which I place below. It is very exciting to have some resulting plots come out of the database that I spent my summer creating, and it will be exciting to see what other results come out of this catalog! I presented the presentation on Wednesday to the department.
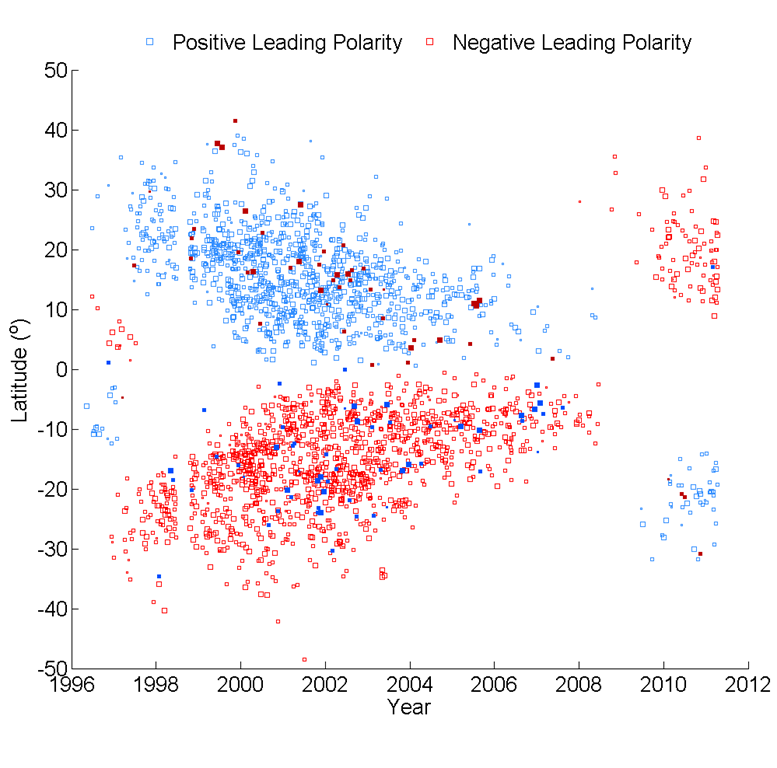
Butterfly Diagram

The butterfly diagram shows how the latitudes of the active regions change over time. They start out at high latitudes at the beginning of the cycle and then migrate towards the equator at the end of the cycle. The main cycle which can be seen above is Cycle 23, which lasted from 1996 to 2008; you can also see the beginning of Cycle 24. The blue points indicate those active regions with a positive leading polarity, and the red points indicate active regions with a negative leading polarity. Note that one polarity leads in the northern hemisphere and the opposite polarity leads in the southern hemisphere; this is known as Hale's Law. These polarities then flip in the next cycle. Only about 5% of the active regions in our dataset (shown in bold) violate Hale's Law.
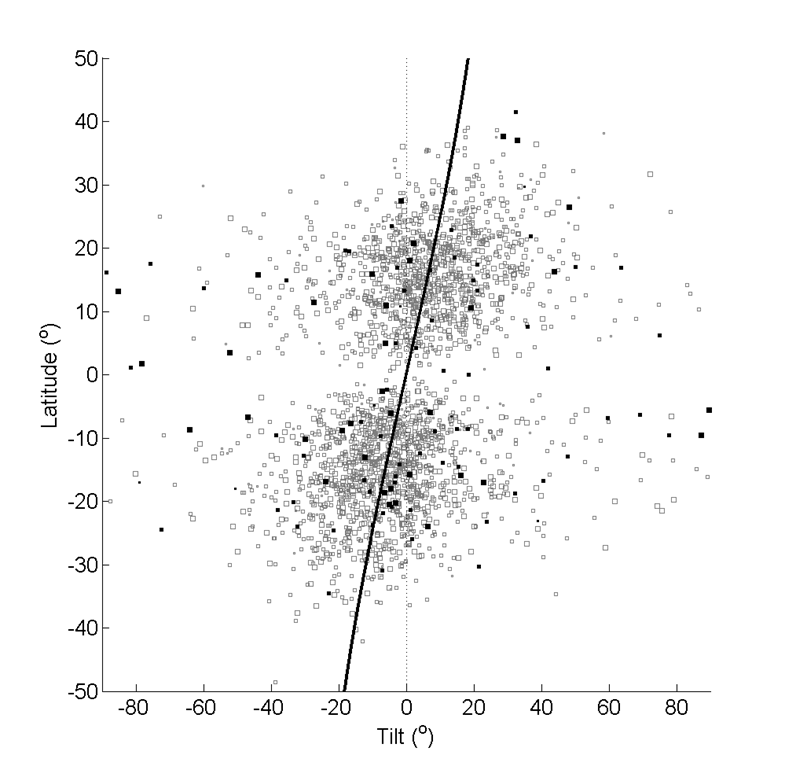
Joy's Law

This plot shows the latitude of the active regions and their tilt; that is, the level of inclination that they have towards the equator. Joy's Law says that as the latitude of the active regions increases, the level of inclination also increases. There is a lot of scatter, but the line through the data points above clearly shows this tendency.
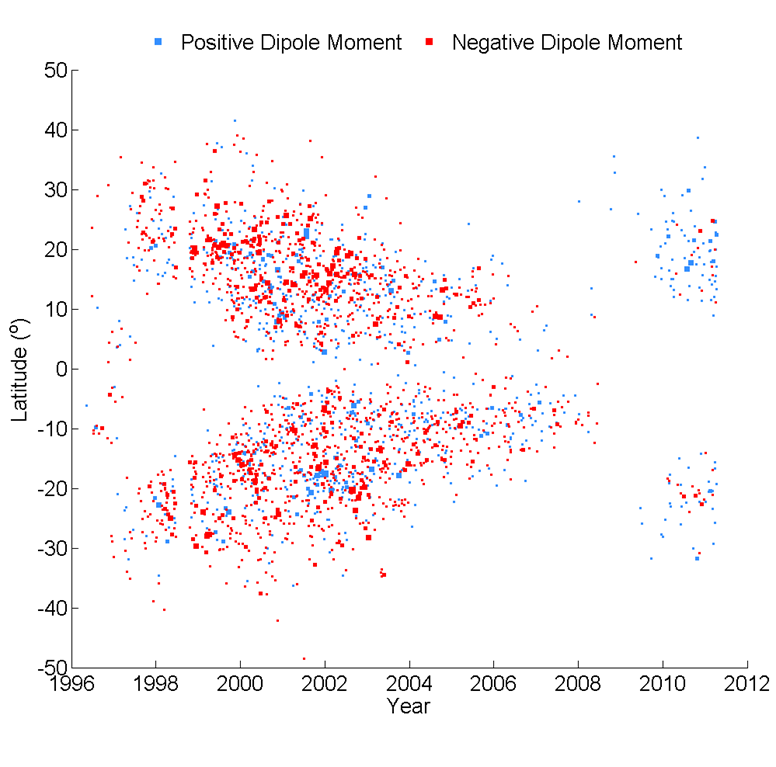
Dipolar Contribution of Active Regions

This plot is similar to the butterfly diagram, but here the blue points indicate active regions with a positive dipole moment, and the red points indicate active regions with a negative dipole moment. In the cycle that the MDI dataset covers (Cycle 23), it is clear that the negative dipole moment dominates in both hemispheres, creating an overall negative dipole moment that will propogate into the next cycle. A number of active regions have dipole moments that oppose this tendency, but the net dipole moment is negative.
End of the Program
After the final presentations was project wrap-up and program evaluations (with Meg Millhouse) as we said our final goodbyes to the REU program and to Bozeman, Montana. It is a sad moment, although it is exciting to look back on what we have managed to accomplish in our nine weeks here. It has been an awesome summer and I will greatly miss both the program and the people that I have had the joy of befriending here in Montana!
