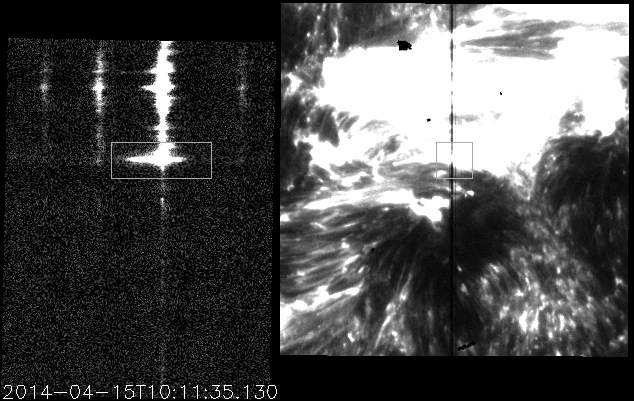
This week, in addition to learning IDL and attending seminars about the Sun, I oriented myself with the IRIS data. I learned how to access the data, watch movies of explosive events, and identify explosive events (EEs) based on the emission lines of the spectra.
Professor Charles Kankelborg wrote software that allows for easy visualization of the spectra over time. Many frames of each region are placed next to each other, so that the size and length of time of each EE is easy to see. The software allows me to draw a box around each EE, which records the x and y coordinates of the events. These coordinates signify where and when the EE occurred, so that we can return to them later and make more detailed notes of them.
Here are some example images of the Sun and its spectra:

