Coronal Temperatures by Year (2008-2011)
Below is the coronal temperatures for the years 2008-2011. The data is log-scaled in Kelvins.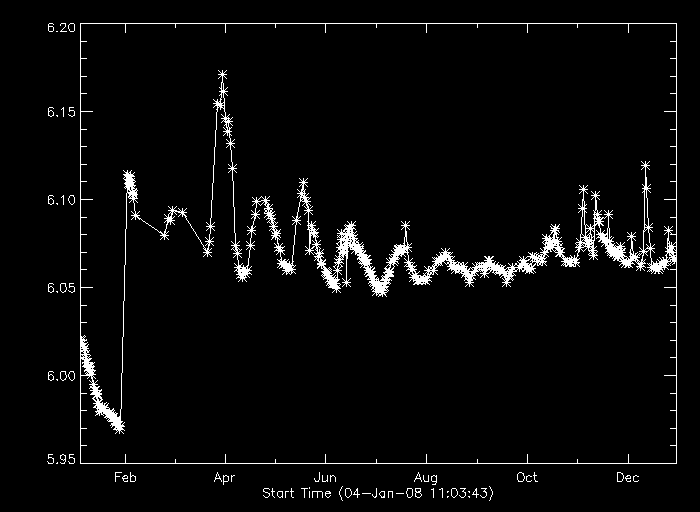
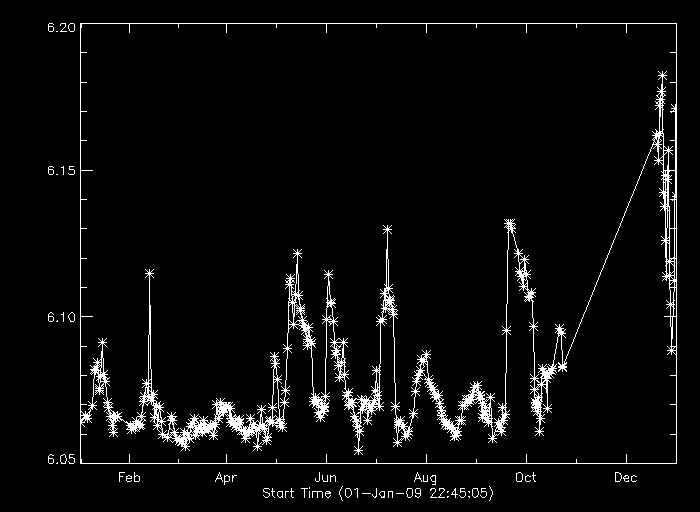
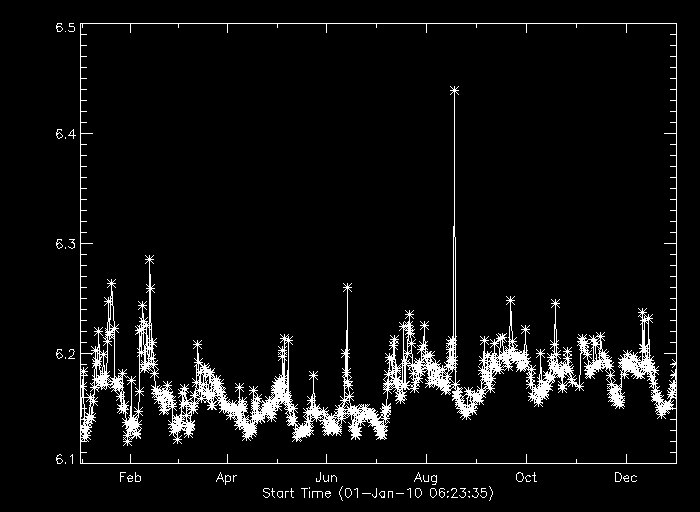
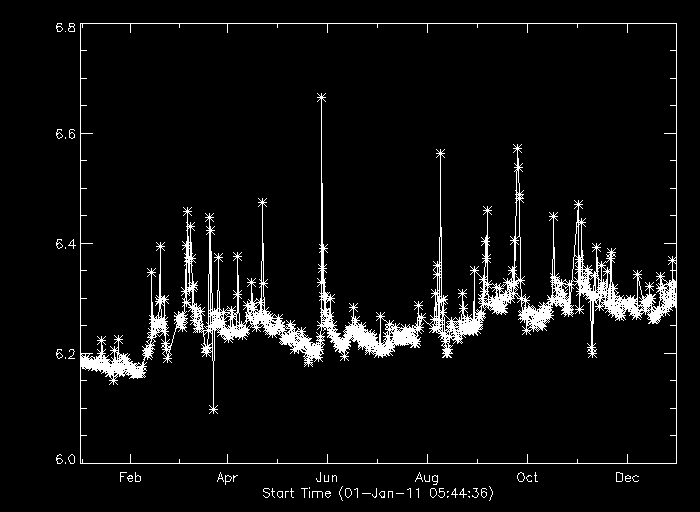
Below is the coronal temperature analysis over a 4 year period.

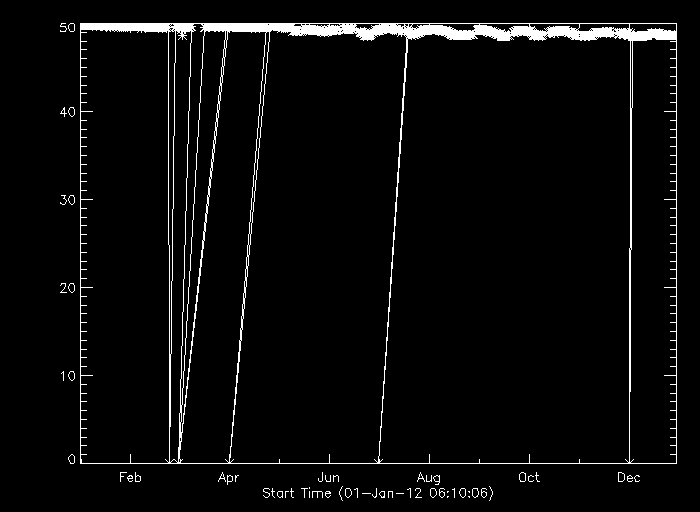
Bonus 2012 data:
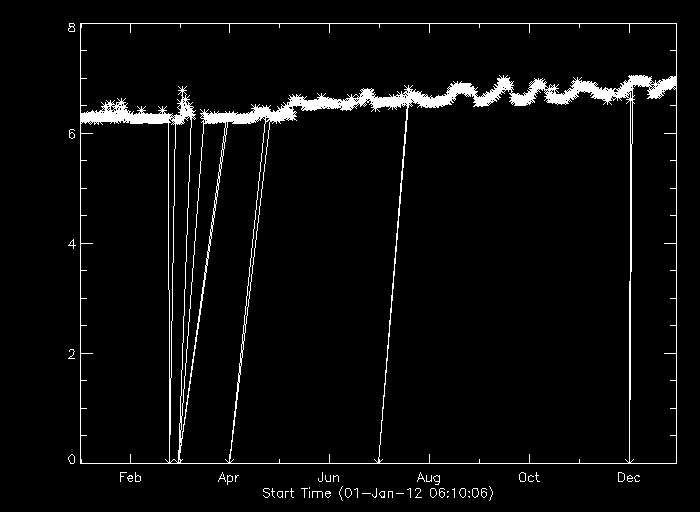
This data is unreliable. Not only is there bad data in the plot, this year is when the XRT began requiring new calibration due to filter holes, light leaks, ccd build up, and age.
Volume Emission Measure by Year (2008-2011)
Below is the VEM for the years 2008-2011. The data is in electrons per cubic cm.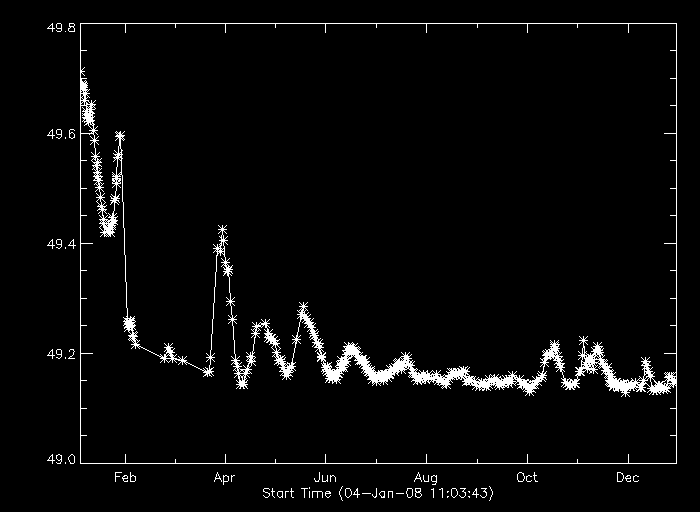
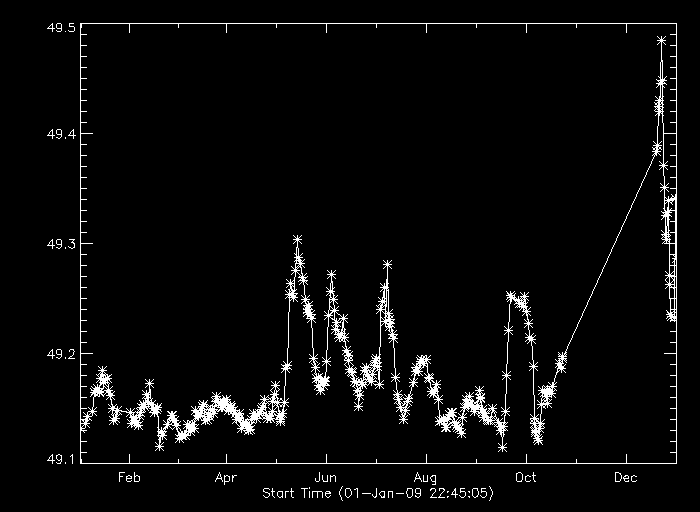
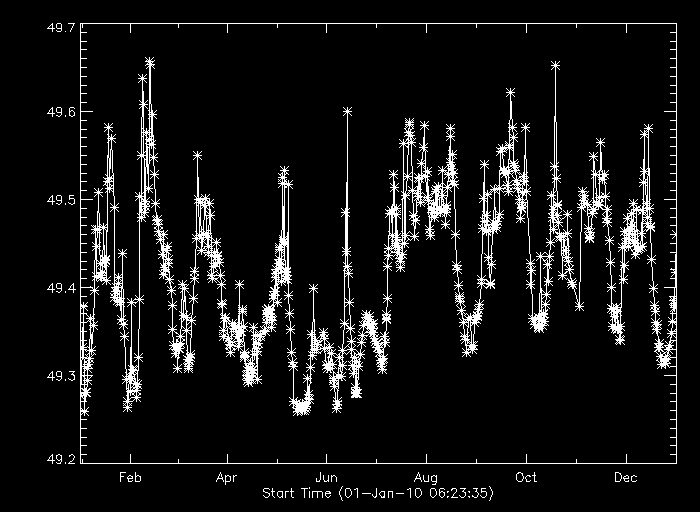
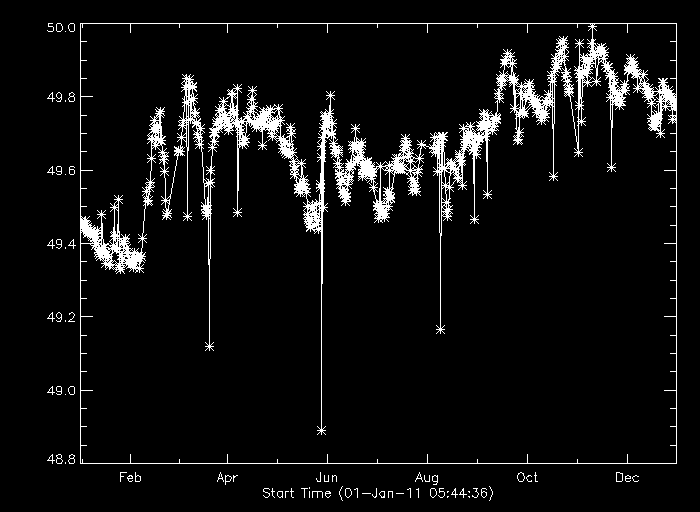
Below is the coronal temperature analysis over a 4 year period.

Bonus 2012 data:
