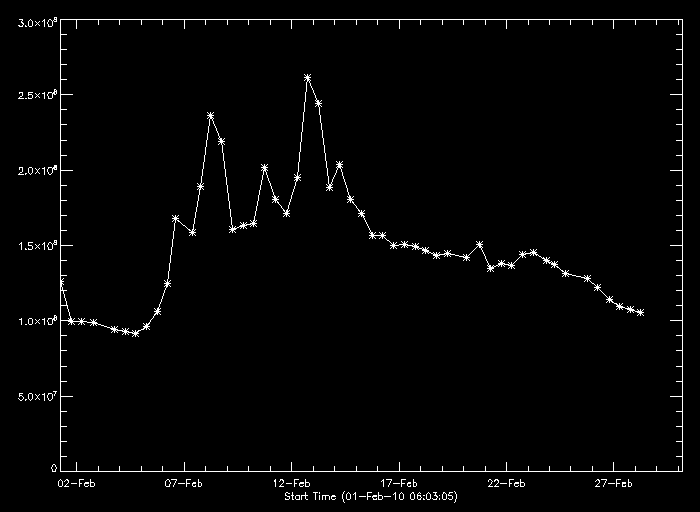
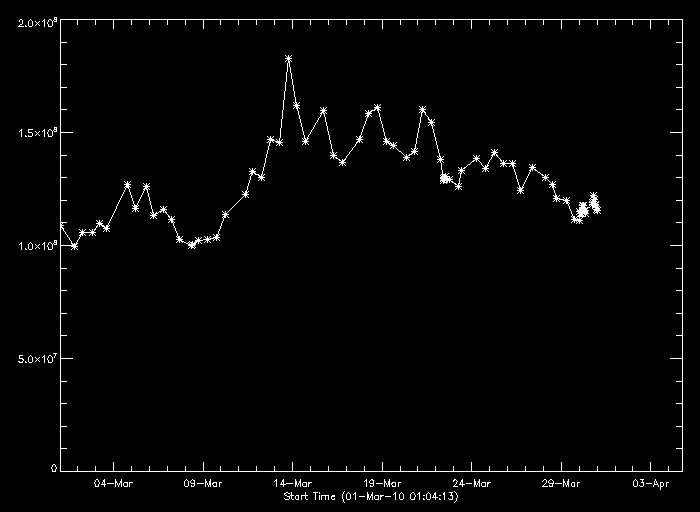
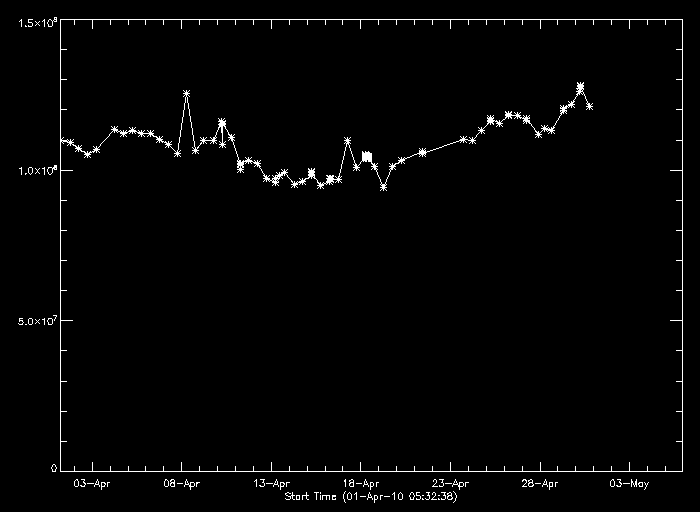
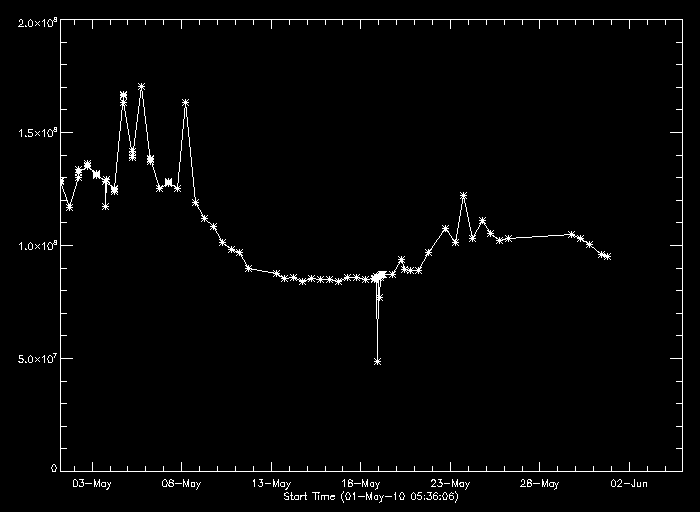
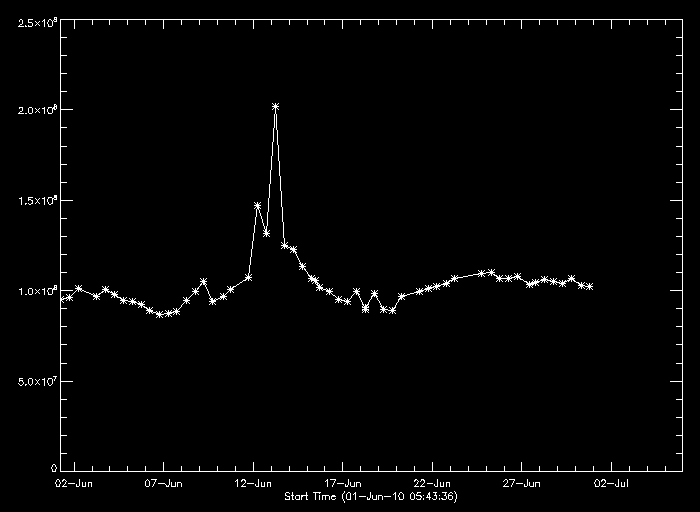
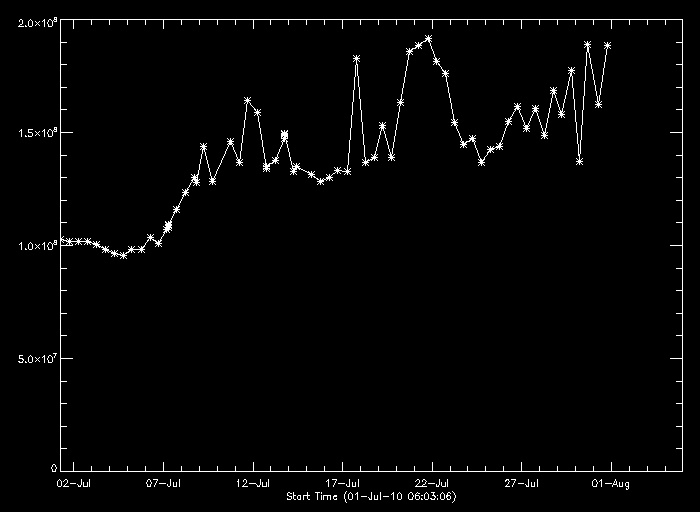
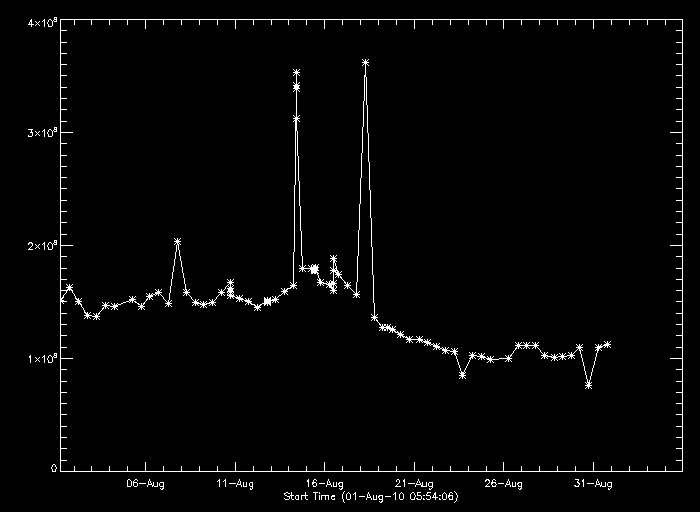
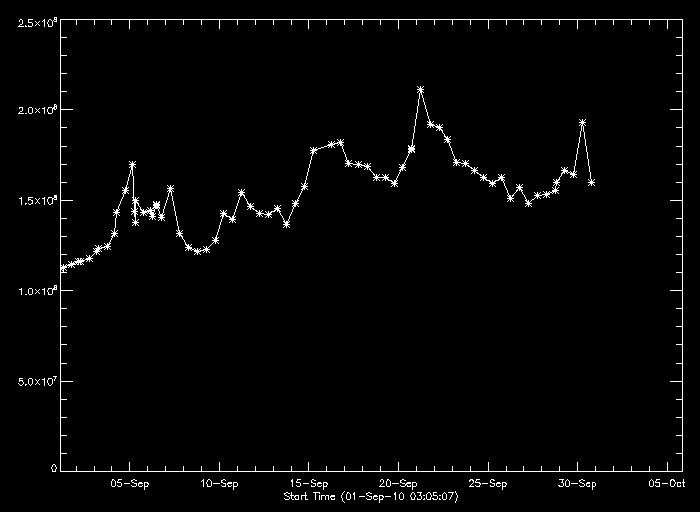
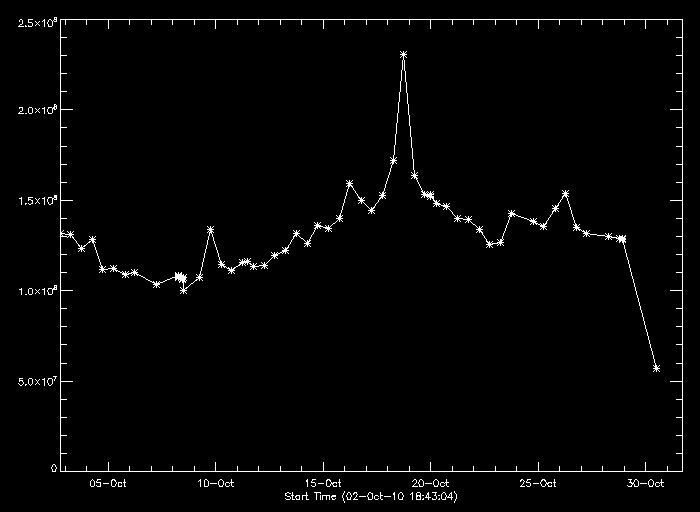
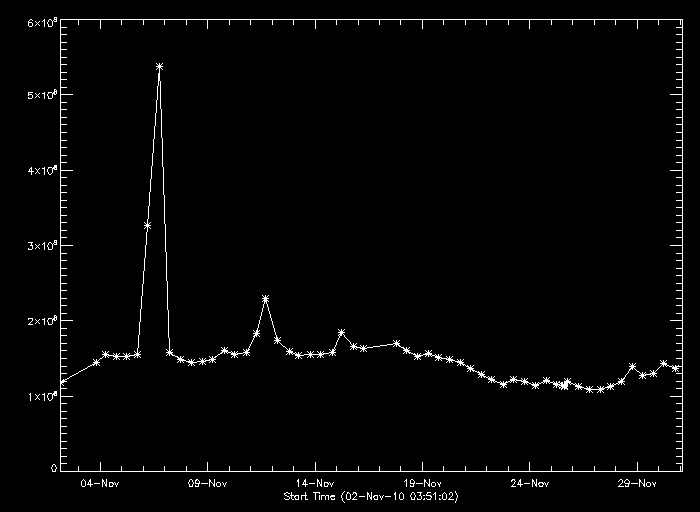
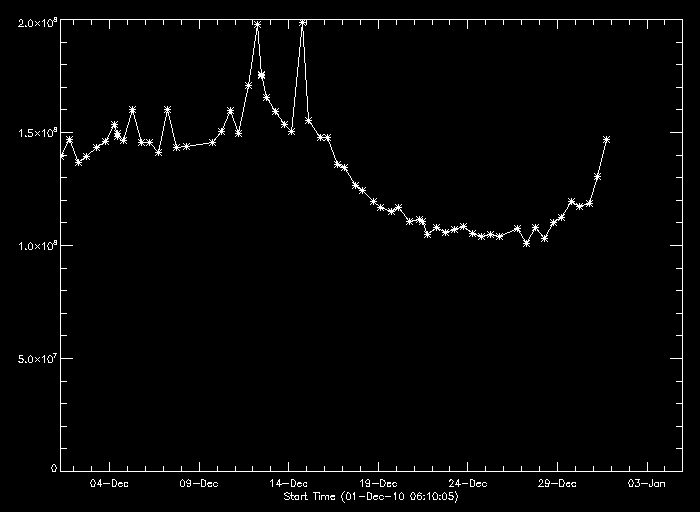
This project will analyze the solar x-ray irradiance gathered from the entire sun by the Japanese Hinode satellite X-Ray Telescope. The goal of this project is to devise a way to analyze the data collected from the entire sun by the XRT over the past 10 years in an efficient manner, and display it in a coherent way. The data can be collected by analyzing data sepearately and combining later, or analyzing data all at once; this data can be used to demonstrate the 11 year cycle of solar activity in the corona.
Data
The data is collected by a charge coupled device (ccd), which converts photon energy into free electrons, in the XRT, as the x-rays are passed through a pre-filter, reflected off of a ring of metal, and focused toward the ccd. Before incidence on the ccd, the x-rays are sent through two filter wheels, of which the filters can be changed to allow certain wavelengths through, as each has a different mesh size. This data is then sent to the Japan Aerospace Exploration Agency (JAXA) and stored for scientists to use. Montana State University has a mirror of this database running locally, which is the third largest Hinode database in the world.
Program
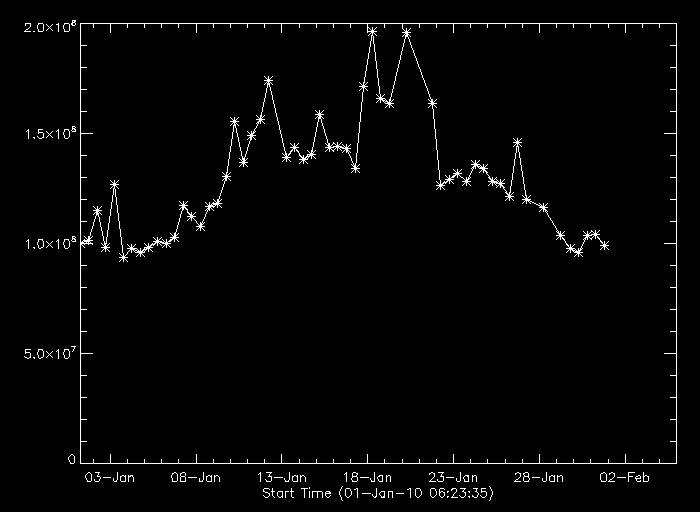 The program begins by searching for .fits files in the given directory marked by the year (yyyy) and month (mm) provided. In this case, that is the month of January 2010. The program then searches in the directory for all instances where data was collected with the first filter wheel of the XRT open, and the second filter wheel of the XRT set to Al_mesh. Then the number of elements is defined as a variable to be used in an array later. A for loop is then used to multiply data by an exponential to normalize exposures.
A for loop for the number of elements is then used to create a "movie" of the images gathered, masked by a circle. This creates an image of the sun, that is "drawn" for all data sets, and displayed in the first of two windows. The second window gathers data from the data sets that fit the filter wheel variables, and plots them with the given days. The x-axis is the month of January 2010 from which the data is collected, and the y-axis appears to be the number of x-ray photons incident on the ccd. Information about the movie and plot are then shared with the help command, such as the size of each data array and the number of them. In this example, it is a three dimensional array of 512x512 data points, made up of 56 separate data sets, which means the movie created will have 56 frames. This knowledge can be gathered by both the DDAM2 data matrix size, as well as the STRUCT array size. This array size makes sense due to only low resolution images being taken of the full sun. The XRT also images the full sun only twice per day, except while the ccd is being cleaned, so the number of images for the month of January 2010 should be just under 62, which 56 is.
The program then saves the plot as an image file. It does this by first selecting the plot window to save, and then takes an image of the plot and exports it into a .png file.
Collected Data
Below is irradiance data collected from the satellite for the full year of Jan-Dec 2010, using the open and Al_mesh filters.

