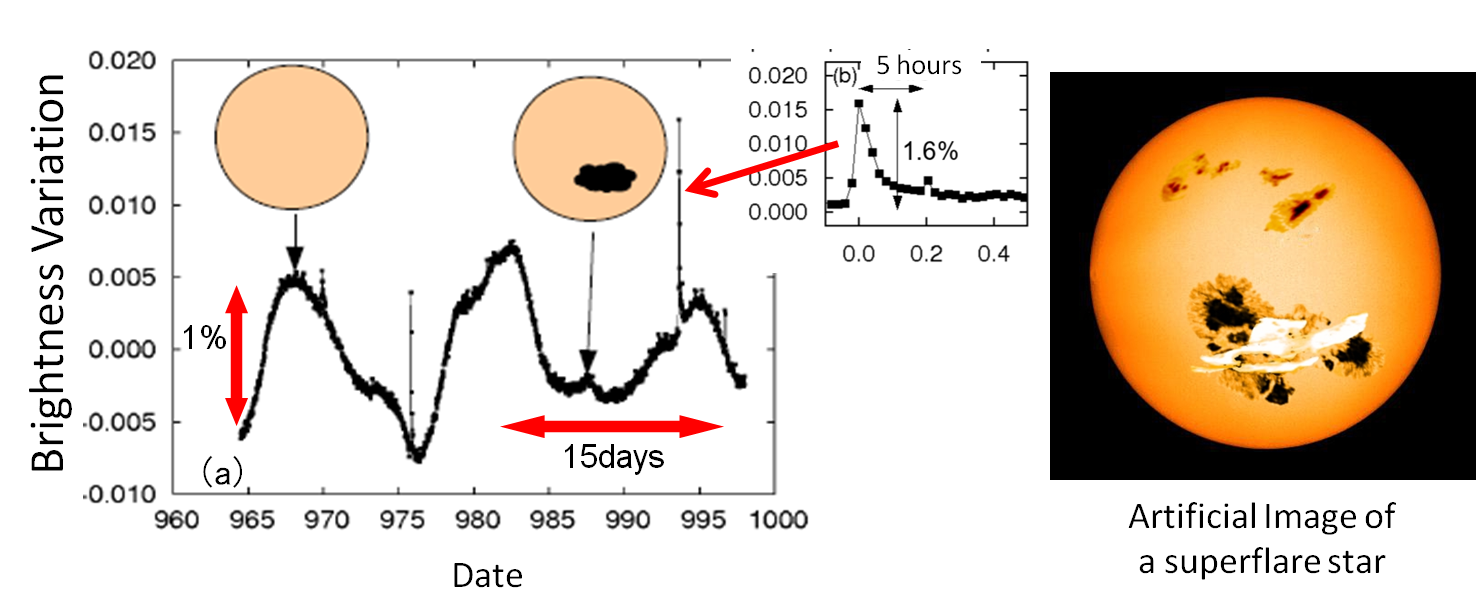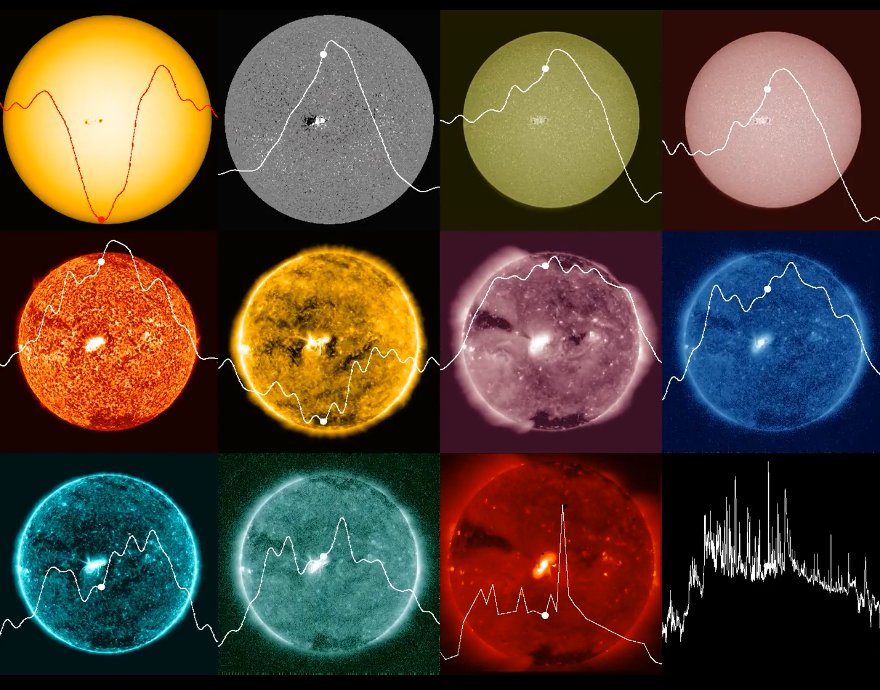
Stellar and solar flares share a common driving mechanism :
mangetic reconnection.
Multi-wavelength observation enables to probe :
- visible light : photosphere
- UV : chromosphere
- EUV & X-ray : TR and corona
Investigate "Sun-as-a-star light curves" :
full-Sun integrated transit curves of
- AR
- plage
- emerging flux region
as listed in Table 1 (NOTE: they are observed as an "almost"
isolated structure during disk passage)
using the data from
-
SORCE/TIM (Total Solar Irrad.)
- SDO/HMI (continuum and magnetic field)
- SDO/AIA (UV and EUV, cf. Table 2)
-
Hinode/XRT (soft X-ray, Al_mesh and Al_poly filters)
- GOES/XRS (1-8A)
Caveat: applicability of the results to stars limited to Sun-like stars.
2. Data Analysis
2.1 SORCE/TIM
- SORCE : SOlar Radiation and Climate Experiment
- Low-Earth Orbit satellite (645km, 40° inc.)
- in operation through 2003 Jan. --- 2020 Feb.
- Operated by LASP and Univ of Colorado.
- instruments:
- Spectral Irradiance Monitor (SIM),
- Solar Stellar Irradiance Comparison Experiment (SOLSTICE),
- Total Irradiance Monitor (TIM)
--- an ambient temperature active cavity radiometer,
- the XUV Photometer System (XPS).
TIM data : 6 hourly mean TSI data, smoothed by filtering out 36hr components.
2.2 SDO/HMI
- SDO : Solar Dynamics Observatory
- Geo-stationary orbit satellite (35789km, at 102°W)
- in operation from 2010 Feb. --- present
- instruments:
- HMI: Helioseismic and Magnetic Imager (Stanford),
- AIA: Atmospheric Imaging Assembly (LMSAL),
- EVE: Extreme Ultraviolet Variability Experiment (LASP & CU).
HMI data :
- Continuum at 6173Å --- 4x4 binning normalized by "QS baseline image"
- mask out magnetized pixels (>5G)
- averaged along azimuthal direction
- to take ratio with HMI image (to correct limb darkening effect)
- Magnetid field (unsigned total, LOS and Radial)
Noise reduction by filter out < 36hr components
2.3 SDO/AIA
AIA synoptic data (Level 1.5), 4x4 binning, 1hr cadence, full-disk integrated signals.
cf. Table 2 and Figure 2.
2.4 Hinode/XRT
- Hinode mission (Japan/US/UK collaboration).
- Low-Earth (650km), Sun-synchronous orbit (allows continuous obs for 9 mon/yr).
- in operation from 2006 Sep. --- present.
- instruments:
- XRT: X-Ray Telescope (SAO,NAOJ),
- SOT: Solar Optical Telescope (LMSAL),
- EIS: EUV Imaging Spectrometer (MSSL).
XRT data: Al_mesh and Al_poly filter images from the
Synoptic Composite Image Archive at MSU.
Within ± 15-min from 6 and 18 UT. Full-disk integrated signals.
[my comments]
- SCIA data are composite images.
- 30 min window is too tight.
- stray light contamination on Al_mesh images.
2.5 GOES/XRS
- GOES 16 satellite (operated by NOAA & NASA, built by LMSAL).
- Geo-stationary orbit satellite (35780km, at 75.2°W)
- in operation from 2016 Nov. --- present.
- instruments:
- EXIS : Extreme Ultraviolet and X-ray Irradiance Sensors
- EUVS : Extreme Ultraviolet Sensor
- XRS : X-Ray Sensor
- SUVI: Solar Ultraviolet Imager,
- MAG: Magnetometer,
- SEISS: Space Environment In-Situ Suite
- other Earth observing instruments
XRS data: science quality data (Level 2).
1-8Å band 1-min averaged data.
3. Transit Light Curves
3.1 Sunspot AR 12699
Fig. 3 (plots) and Fig. 4 (movie)
- Sunspot area : 240 MSH (Millionths of Solar Hemisphere).
- Sunspot makes "dip" in TSI (170ppm=0.017%) and Visible cont.(240ppm).
- Sunspot makes "shoulders" in TSI (70ppm) and Visible cont.(80ppm).
- Magnetic field : peak at Central Meridian Passage (CMP).
- EUV : flat-topped mountain-shape curve
except 171Å.
- EUV : 171Å reduces around CMP.
131Å and 94Å detect flares.
- Soft-X : background level enhanced by 30%(Al_mesh) and factor of 10 (GOES).
- 2-day time rag in enhancement of light curves below CH and above TR.
contributed by a loop system with the height of ~40Mm.
3.2 Plage: return of AR 12713
Fig. 5 (plots) and Fig. 6 (movie)
- No sunspot.
- TSI and Visible cont. have "shoulders" but NO "dips".
- Magnetic field end EUV: montain shape (including 171Å).
- light curve time rag exist.
3.3 EFR: AR 12733
Fig. 7 (plots) and Fig. 8 (movie)
- All have asymmetric about the CM (as the region grows).
4. Detailed Analysis of the Light Curve
4.1 Correlations between UV/EUV light curves and Magnetic flux
- High correlation between UV and LOS MF
- Good correlation between EUV and ratial MF
4.2 "Dip" and "Shoulder" in visible light curves
Explained using intensity histogram of 400x400" region.
4.3 Mistery of 171Å light curve
Explained from the AIA DEM study: DEM shift to higher temperature.
|


