|
|
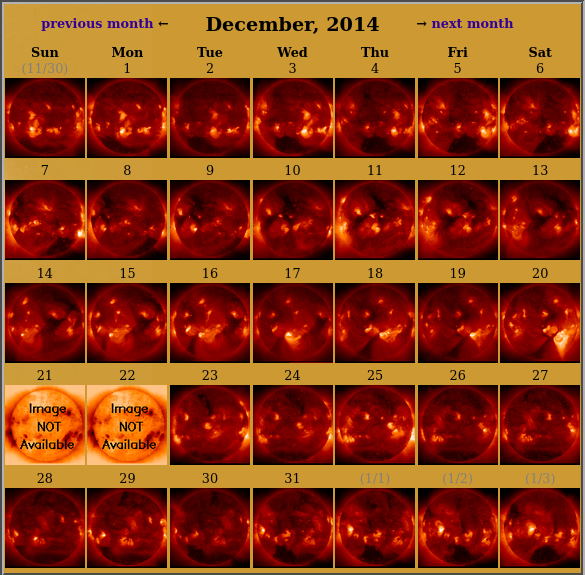
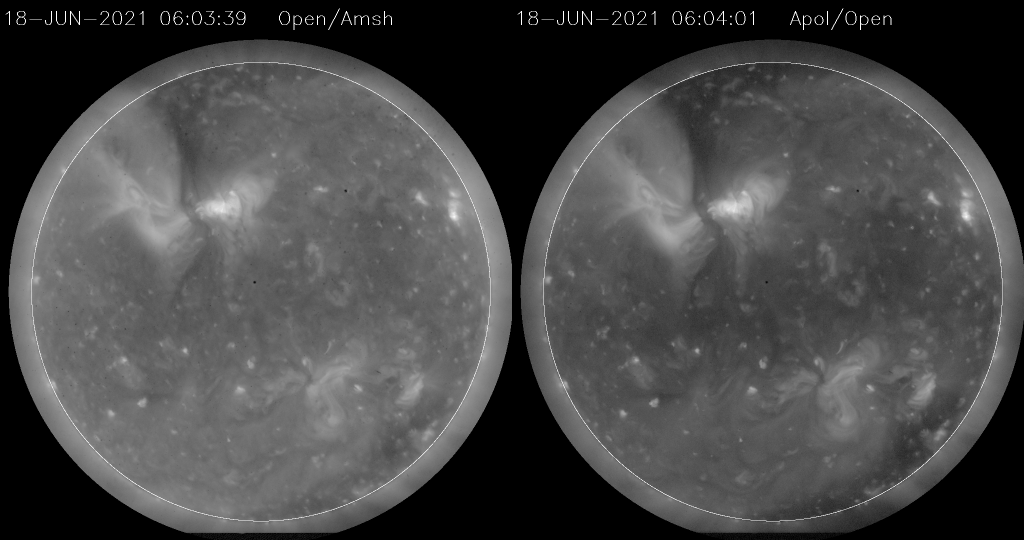
Sample pages from the XRT Synoptic Composite Image Archive (SCIA) (http://solar.physics.montana.edu/HINODE/XRT/SCIA/) |

|

|
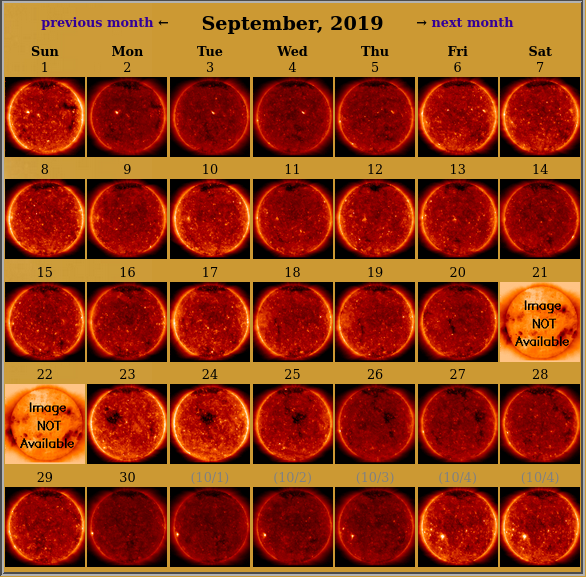
Sample pages from the XRT Synoptic Composite Image Archive (SCIA) (http://solar.physics.montana.edu/HINODE/XRT/SCIA/) |

 |
|
| year | Al_mesh | Ti_poly | Al_poly | thin_Be | Alpl/Tipl | med_Al | thick_Be |
| 2006 | 0 | 2 | 366 | 138 | 0 | 3 | 0 |
| 2007 | 1150 | 1129 | 1614 | 368 | 285 | 24 | 0 |
| 2008 | 426 | 919 | 360 | 38 | 1 | 1 | 0 |
| 2009 | 383 | 727 | 379 | 0 | 0 | 117 | 0 |
| 2010 | 843 | 849 | 6 | 1 | 6 | 2 | 0 |
| 2011 | 714 | 669 | 41 | 371 | 7 | 6 | 0 |
| 2012 | 759 | 764 | 87 | 451 | 6 | 2 | 0 |
| 2013 | 618 | 629 | 88 | 444 | 0 | 0 | 0 |
| 2014 | 690 | 692 | 54 | 641 | 53 | 52 | 50 |
| 2015 | 604 | 450 | 337 | 606 | 109 | 112 | 79 |
| 2016 | 645 | 0 | 667 | 658 | 142 | 171 | 97 |
| 2017 | 664 | 0 | 830 | 652 | 153 | 153 | 114 |
| 2018 | 1214 | 0 | 1214 | 1239 | 144 | 144 | 127 |
| 2019 | 1639 | 0 | 1644 | 1632 | 134 | 135 | 135 |
| 2020 | 1593 | 0 | 1592 | 1602 | 126 | 126 | 135 |
| 2021 | 716 | 0 | 744 | 721 | 65 | 63 | 63 |
| Total | 12658 | 6830 | 10023 | 9562 | 1231 | 1111 | 792 |
|
|
|
| event | date | open area fraction | note |
| 1st | 9-May-2012 | ~0.1% | Ti_poly and C_poly filters started to be affected. |
| 2nd | 14-Jun-2015 | ~3.3% | Ti_poly filter single use disabled. |
| 3rd | 27-May-2017 | ~7.5% | Al_mesh filter started to be affected. |
| 4th | 29-May-2018 | ~9.9% |
| Before stray light subtraction. |
Stray light image obtained in eclipse seasons. |
Stray light subtracted. |
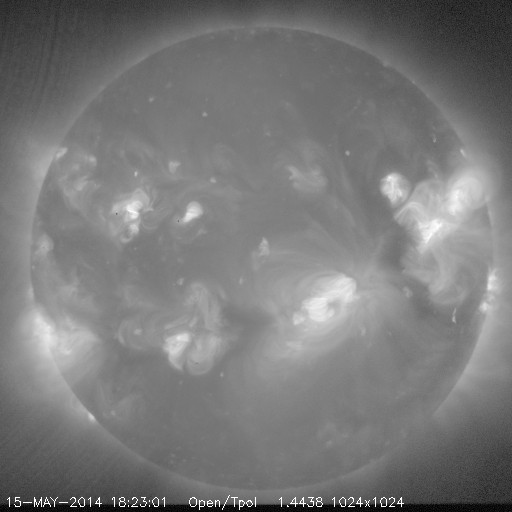 |
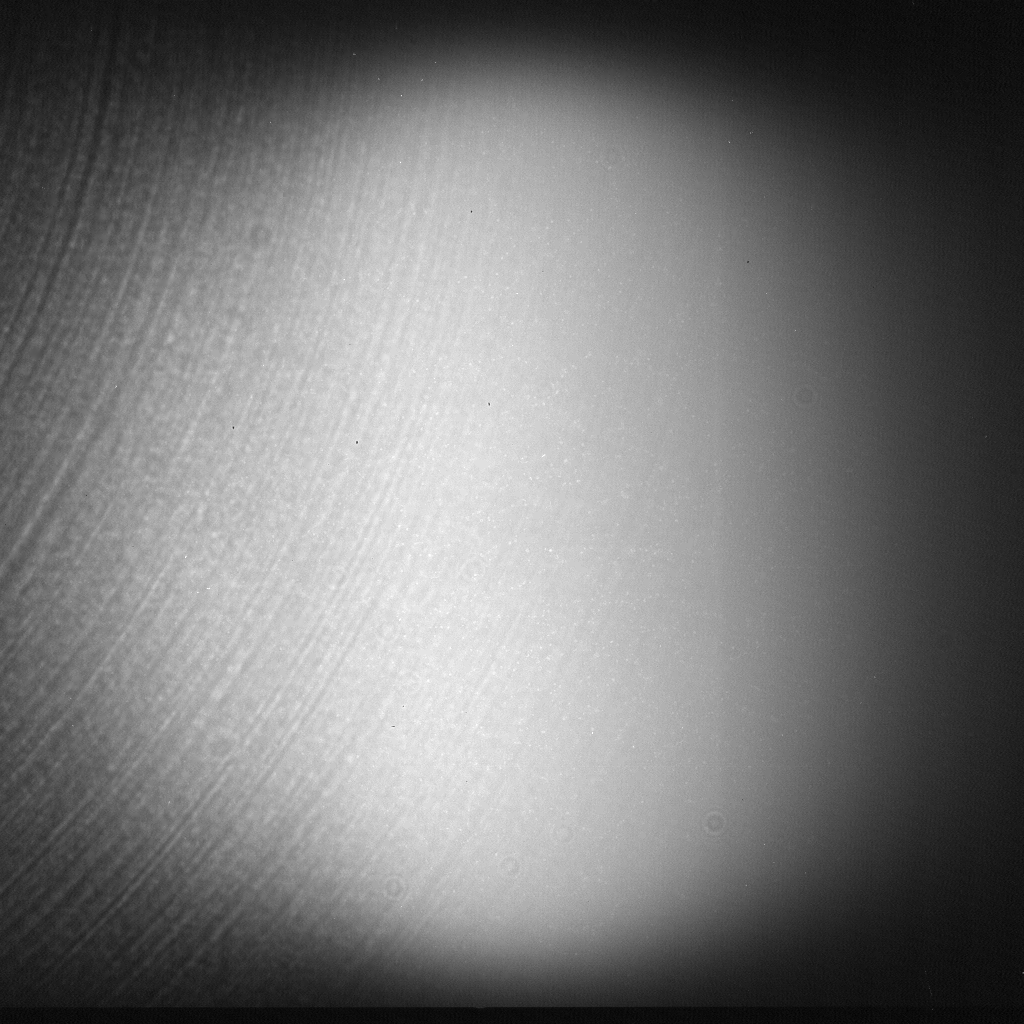 |
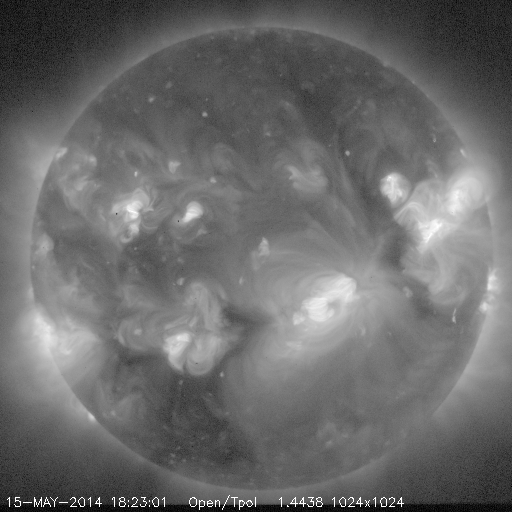 |
| contamination thickness on CCD [plotted by K. Yoshimura (MSU)] |
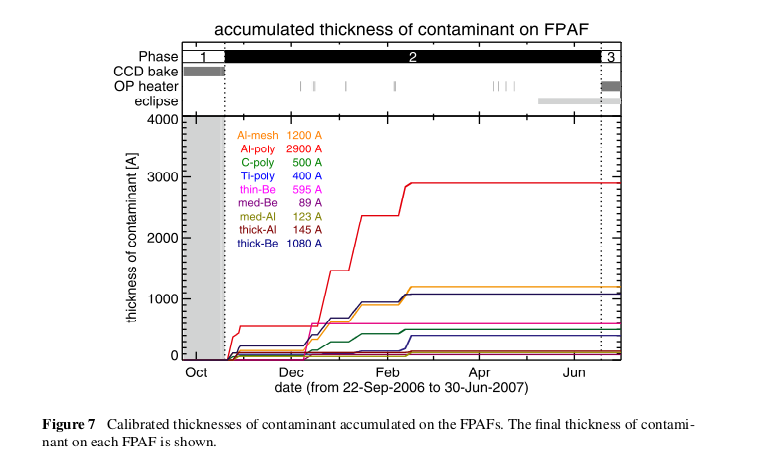
thickness of contamination on X-ray filters from Narukage et al. (2011) |
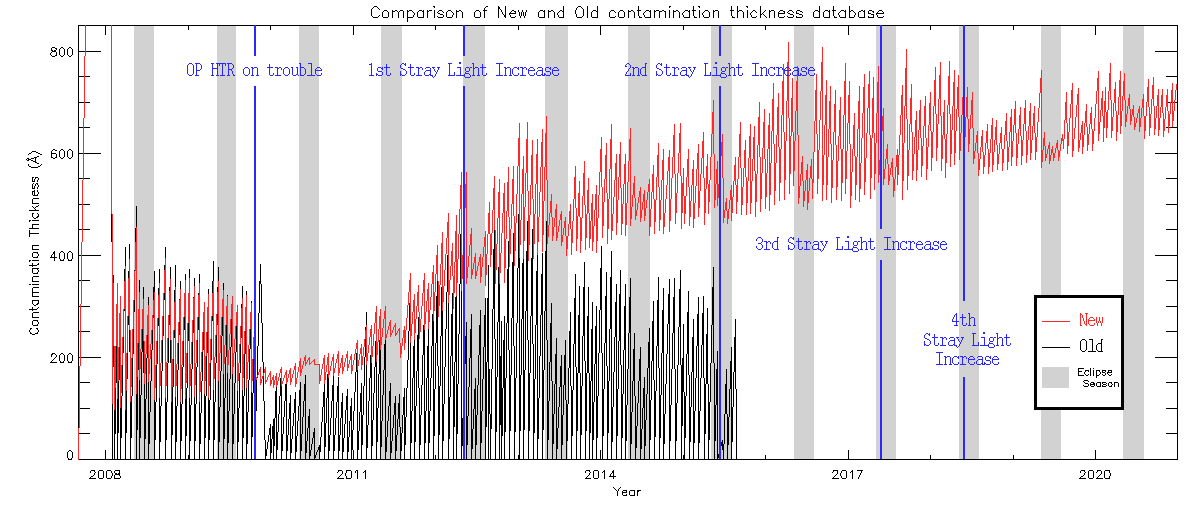
|
|
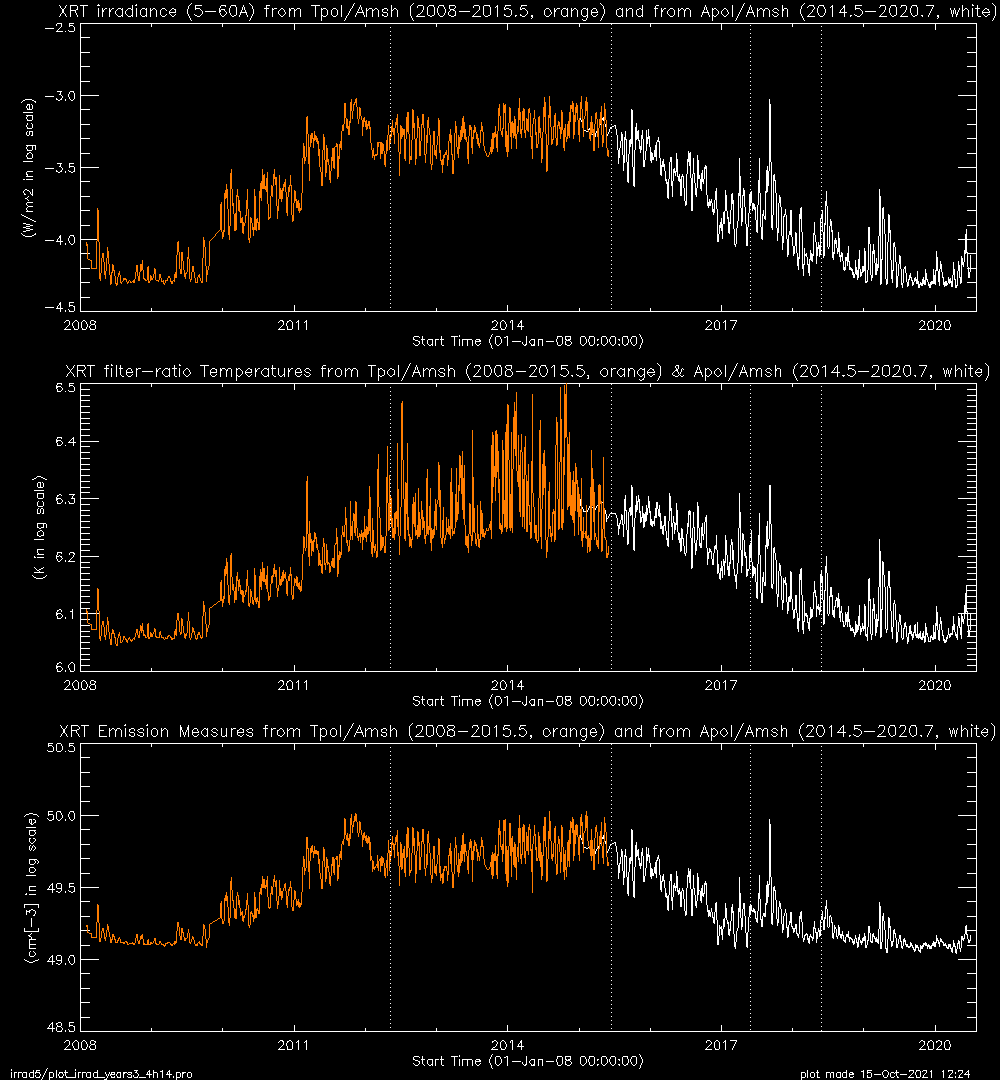
|
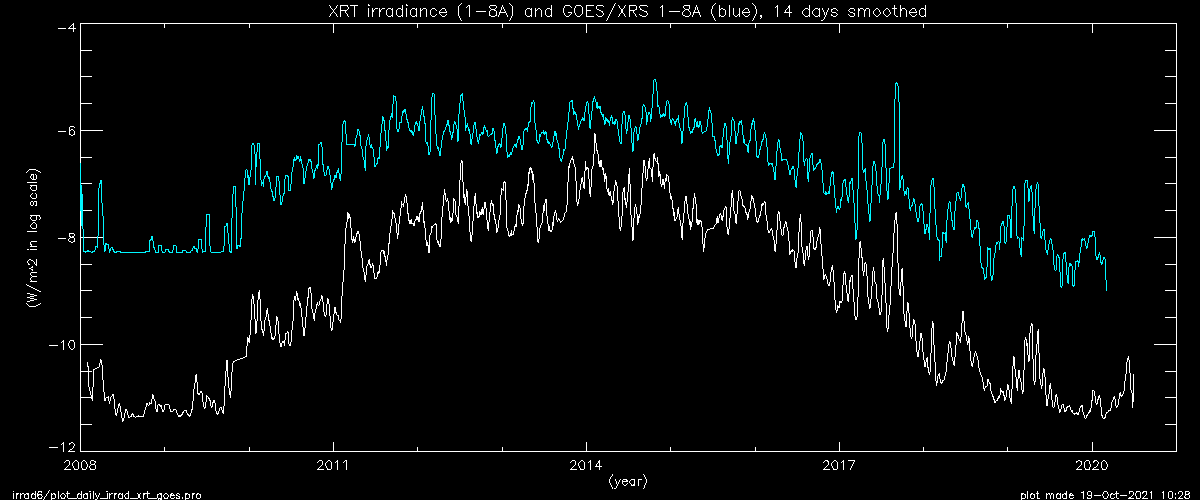
|
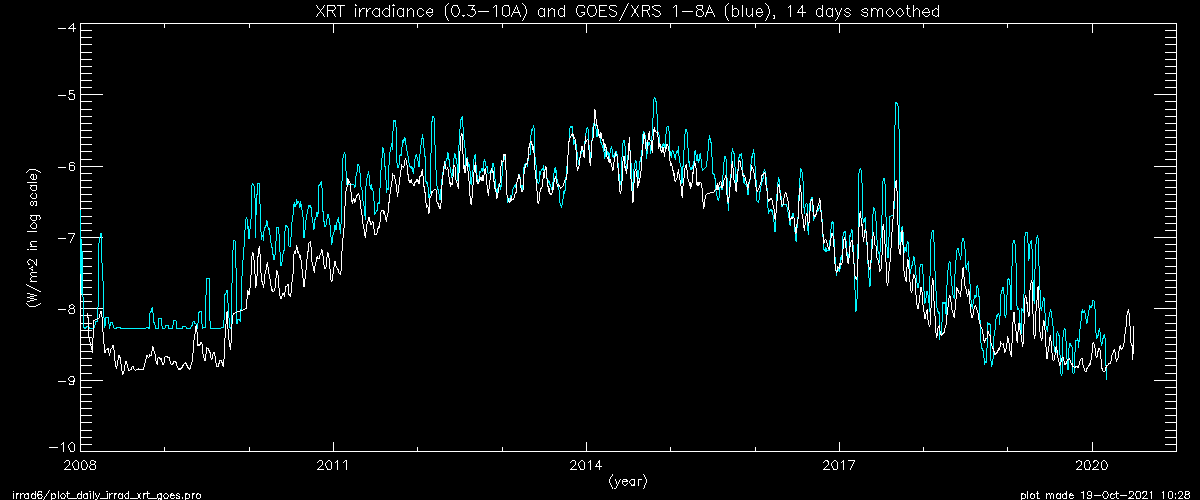
|
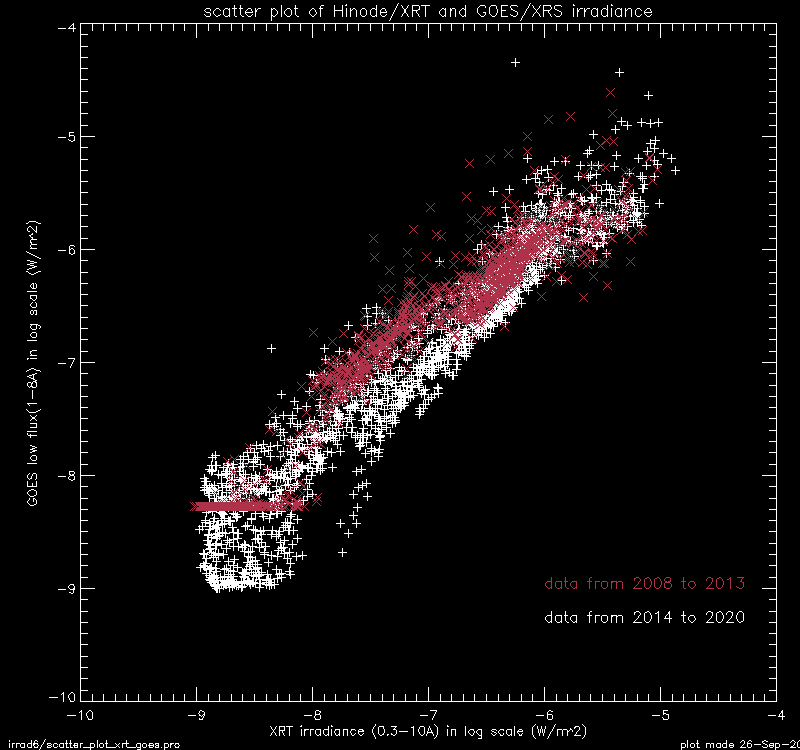
|
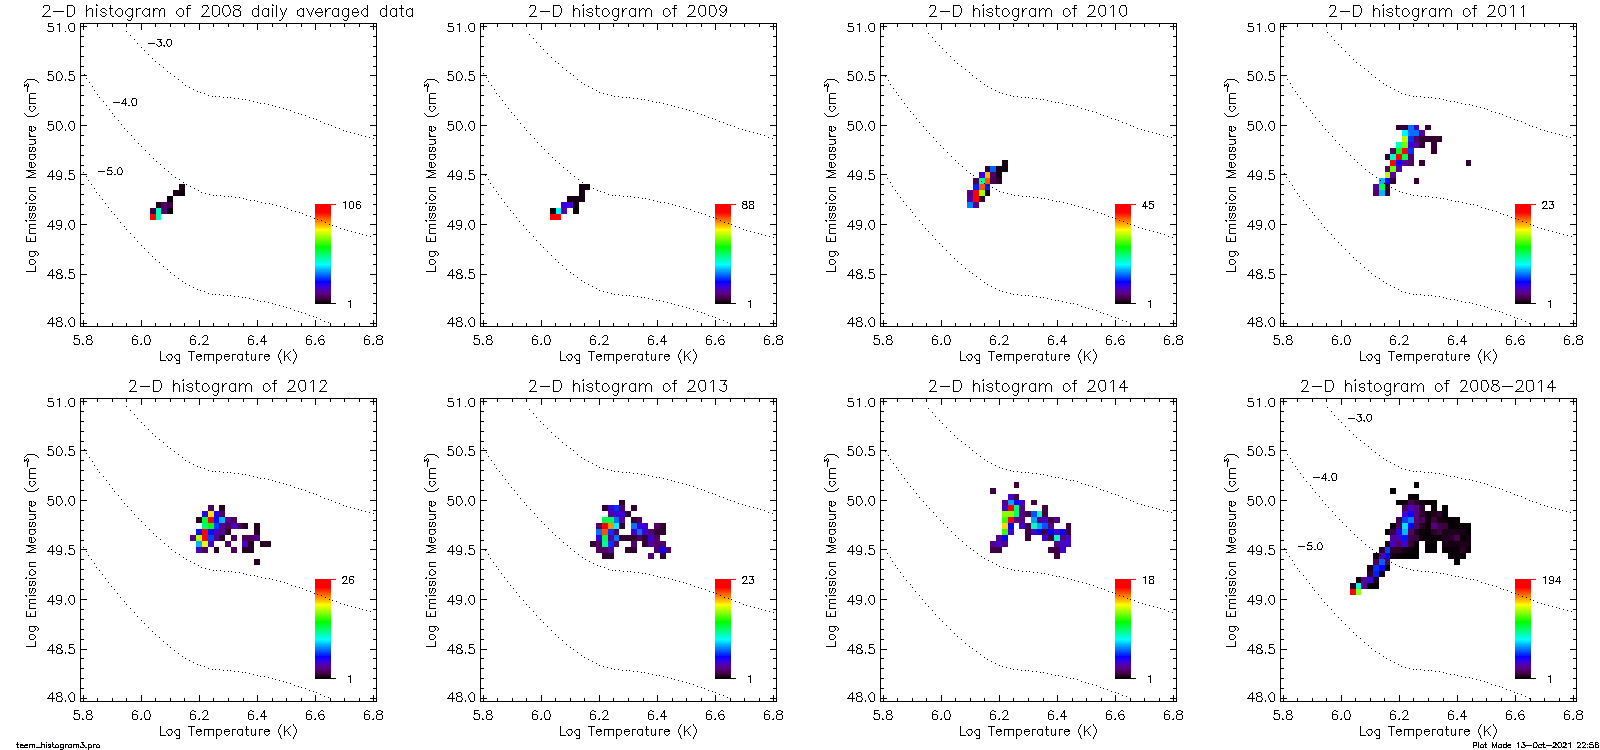
|
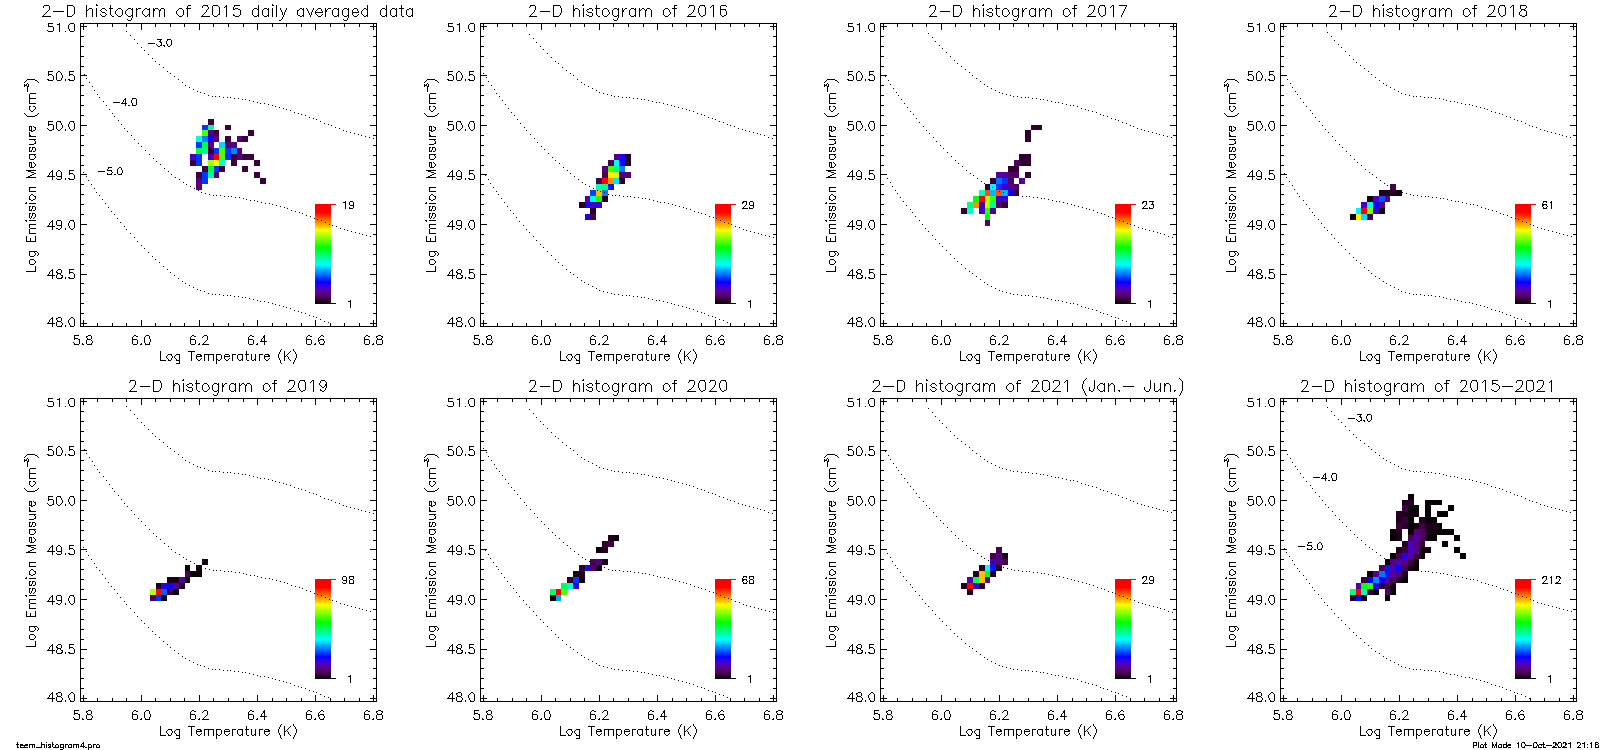
|
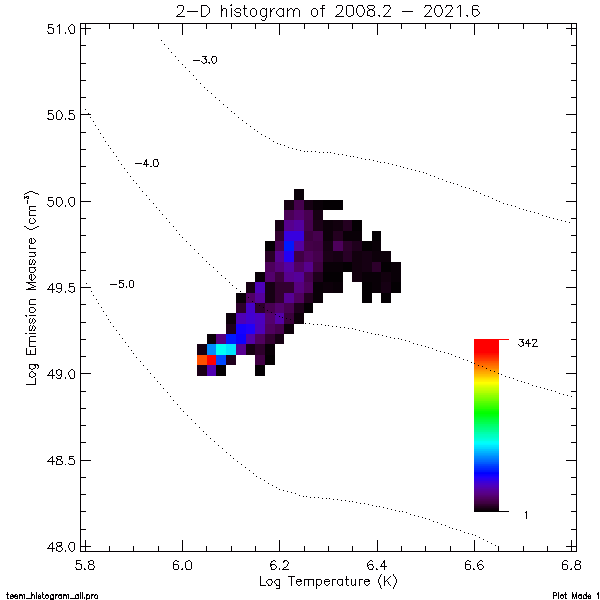
|
|
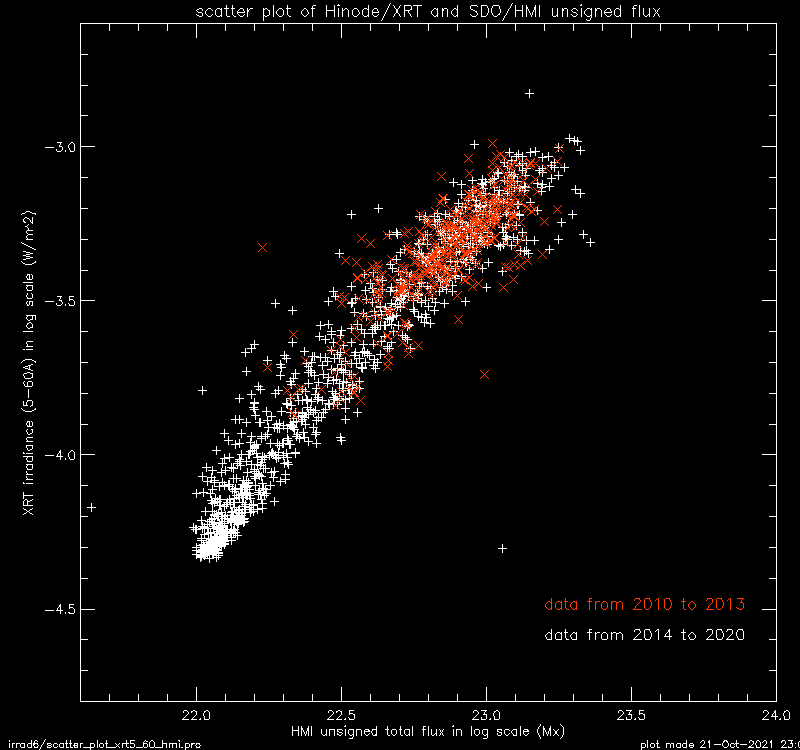
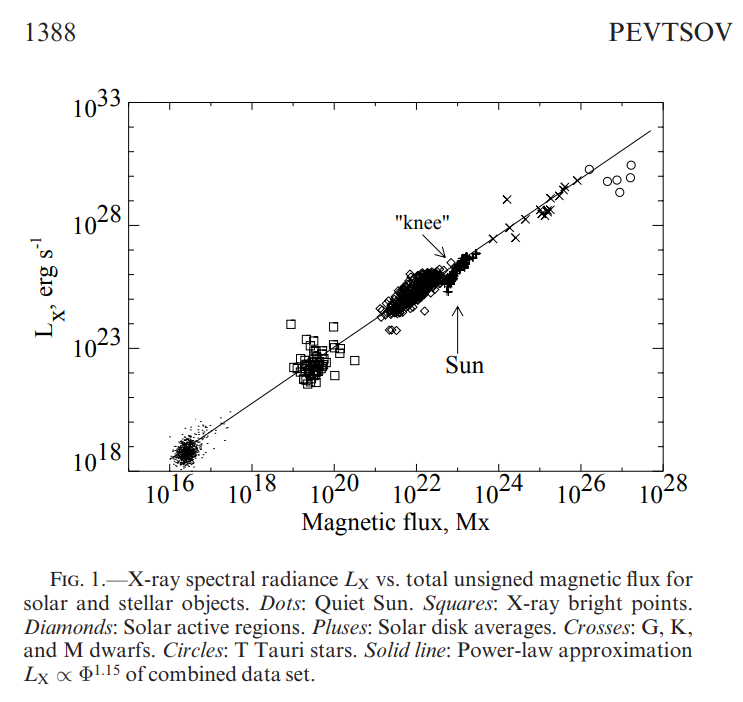
| HMI vs. XRT irrad 5 - 60 Å | plot from Pevtsov et al. (2003) |
|
|
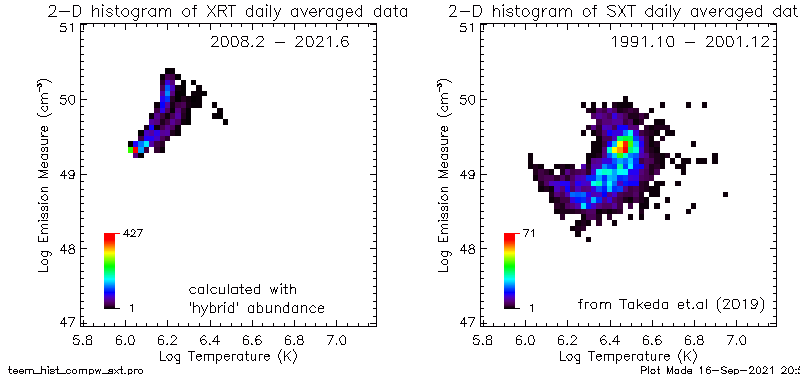
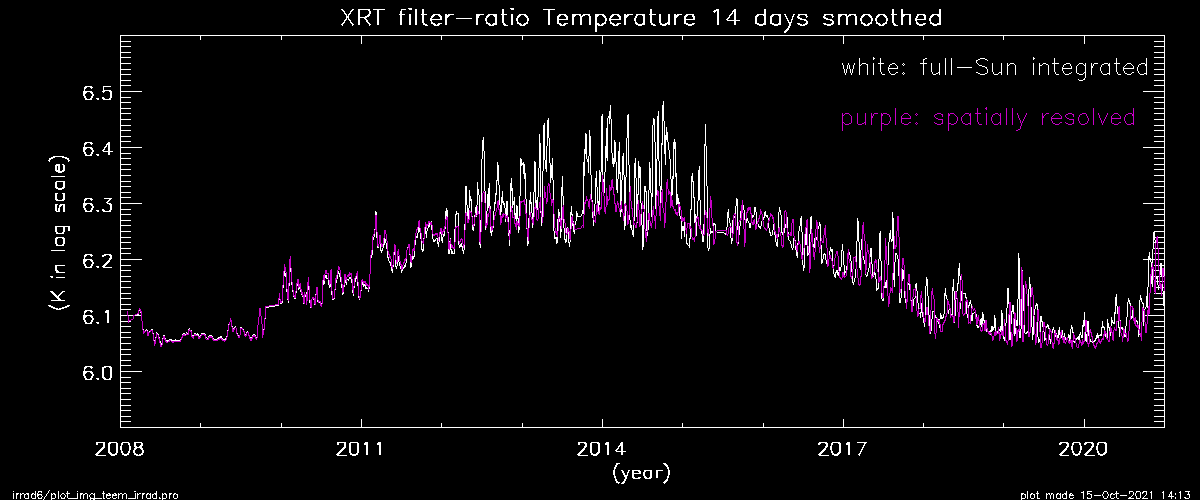
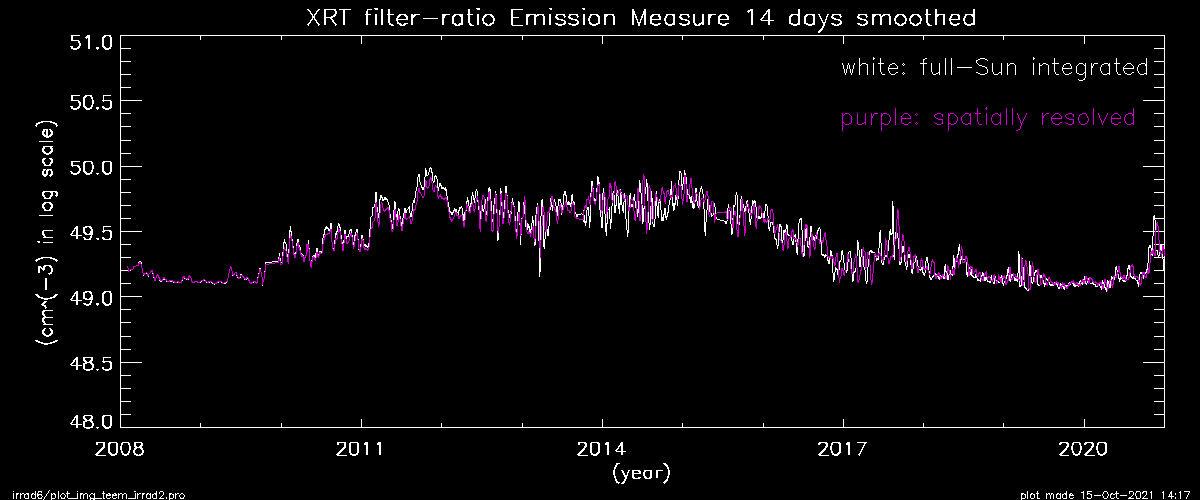
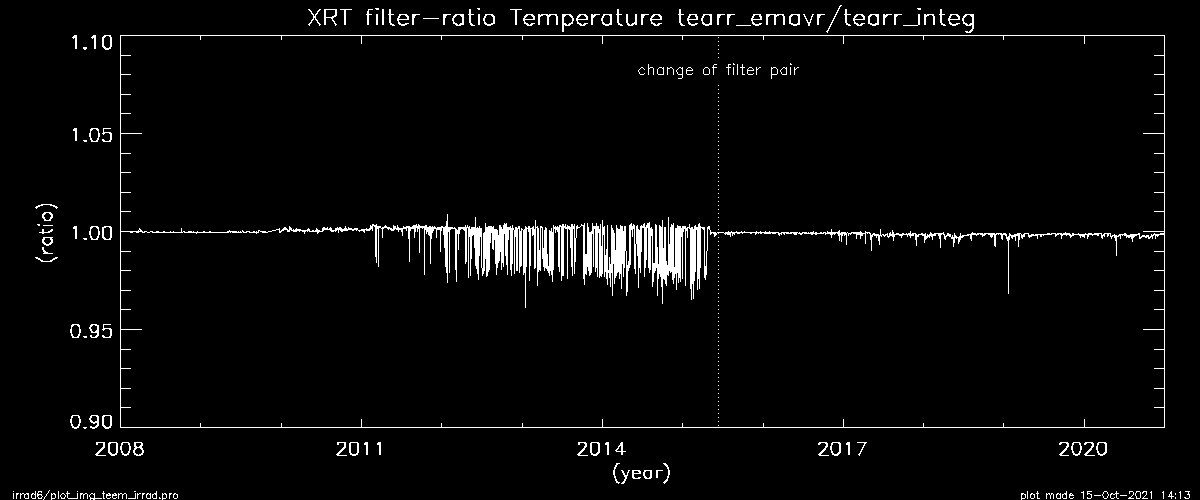
| 2D-Te ⟶ EM weighted average Te | v.s. | full-Sun integrated Te |
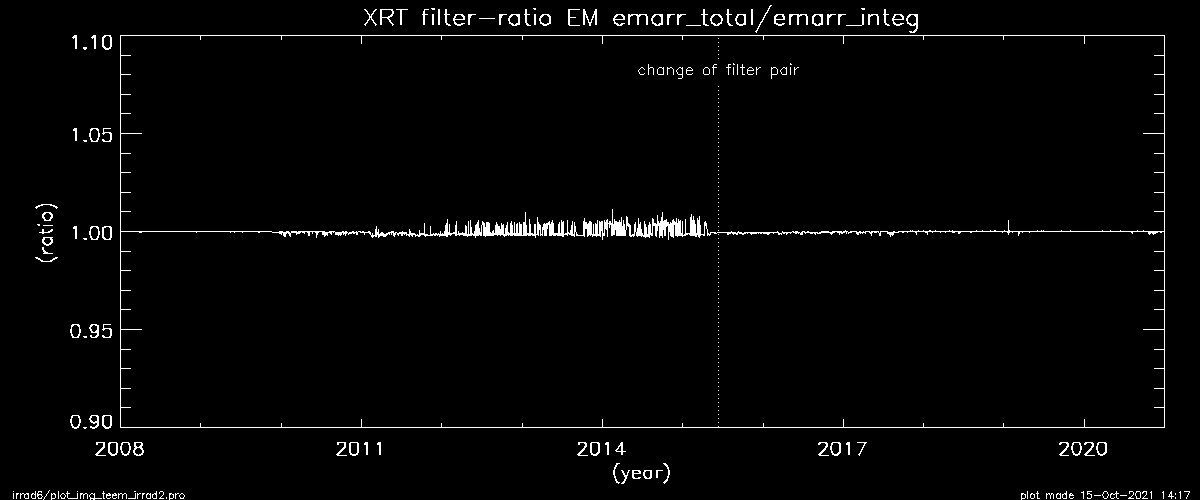
| 2D-EM ⟶ total EM | v.s. | full-Sun integrated EM |
|
|
|
|
XRT 3-temperature movie
|
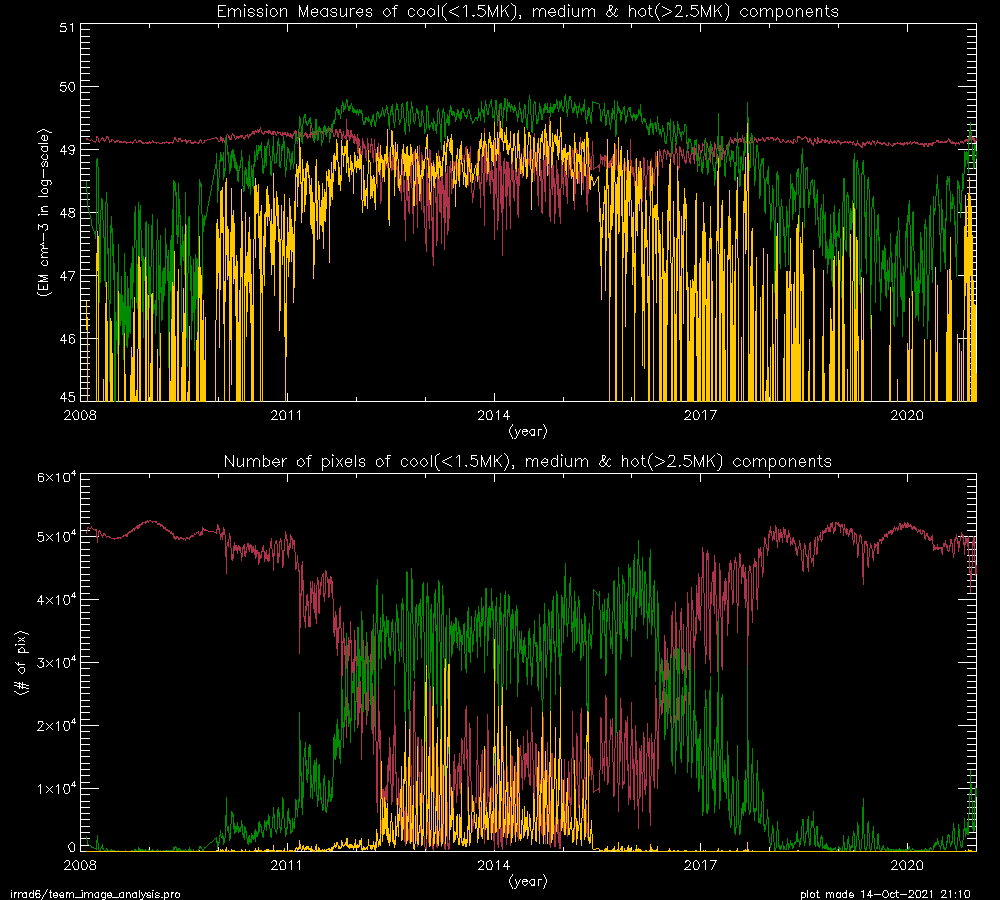
Solar cycle variation of cool/med/hot components
|