Solar Eclipse Observations
--- Historical, recent and some new ones. ---
21 June 2017 by Aki Takeda
(Research Scientist at MSU Dept.of Physics)
1. Introduction
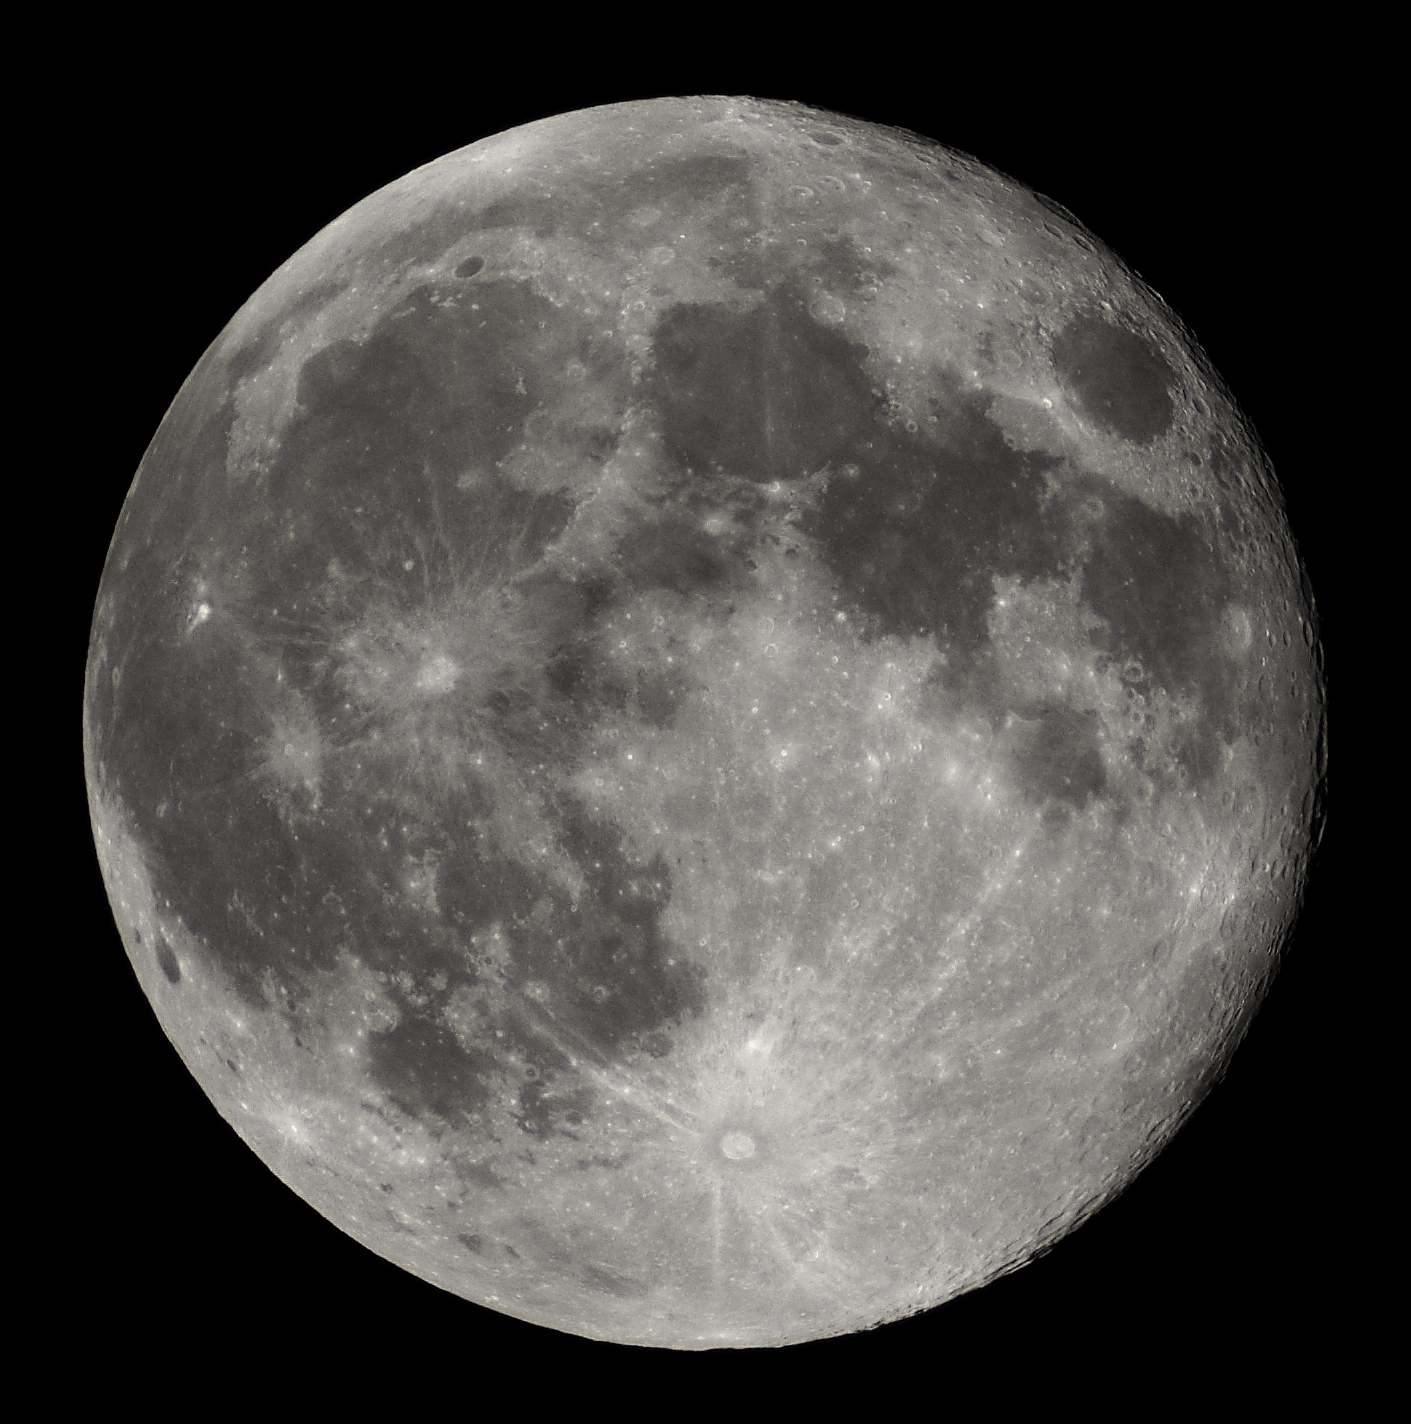
Scale model of Earth - Moon - Sun system

| diameter
(km | mile) |
distance from Earth
(km | mile) |
diameter & distance
in our model E. |
|---|
| Earth | 12,800 | 8,000 | --- |
6 (cm) & ----- |
|---|
| Moon | 3,480 | 2,200 |
380,000 | 240,000 |
1.6 (cm) & 6 (ft) |
|---|
| Sun |
1,400,000 | 88,000 |
150,000,000 | 94,000,000 |
6.5 (m) & 0.44 (mile) |
|---|
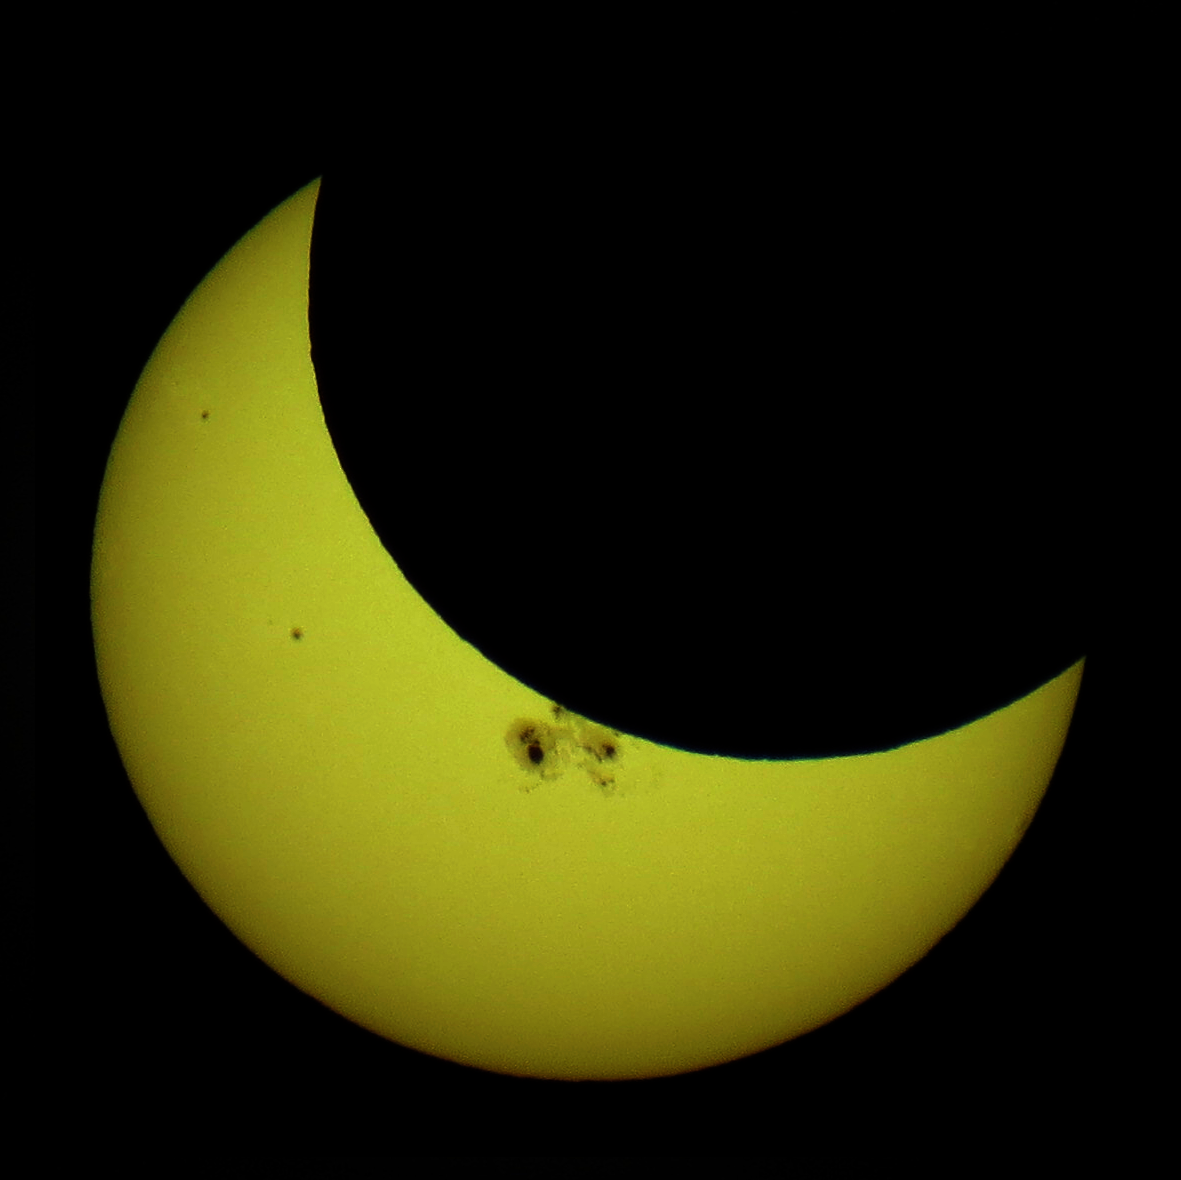
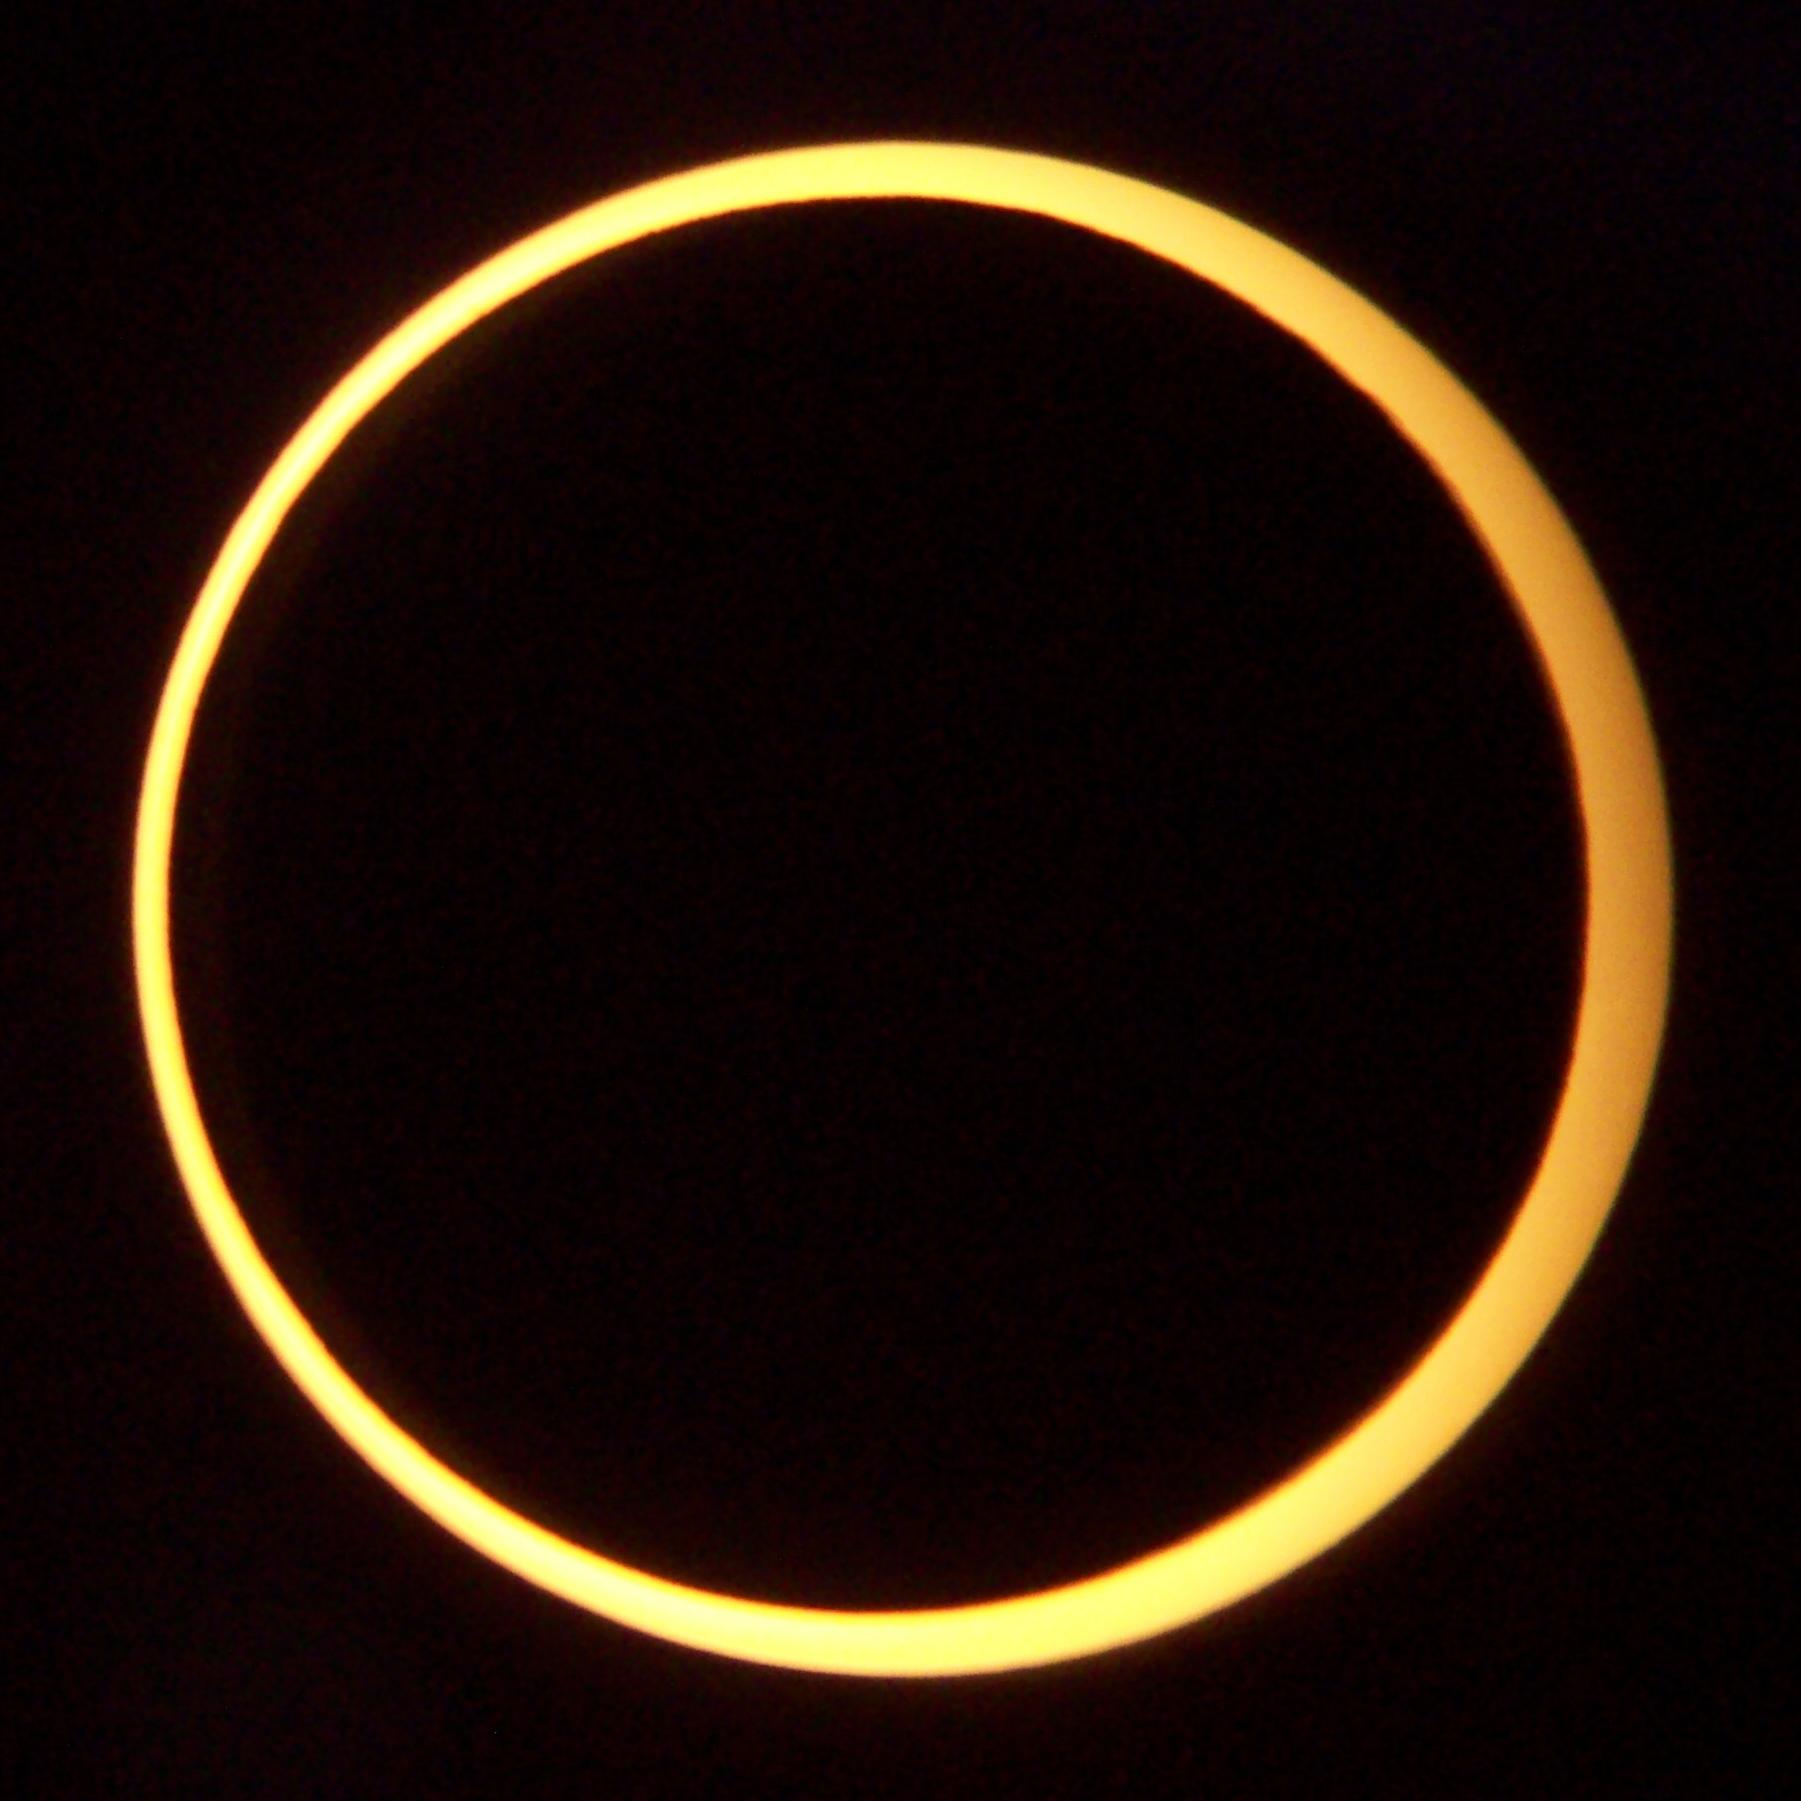
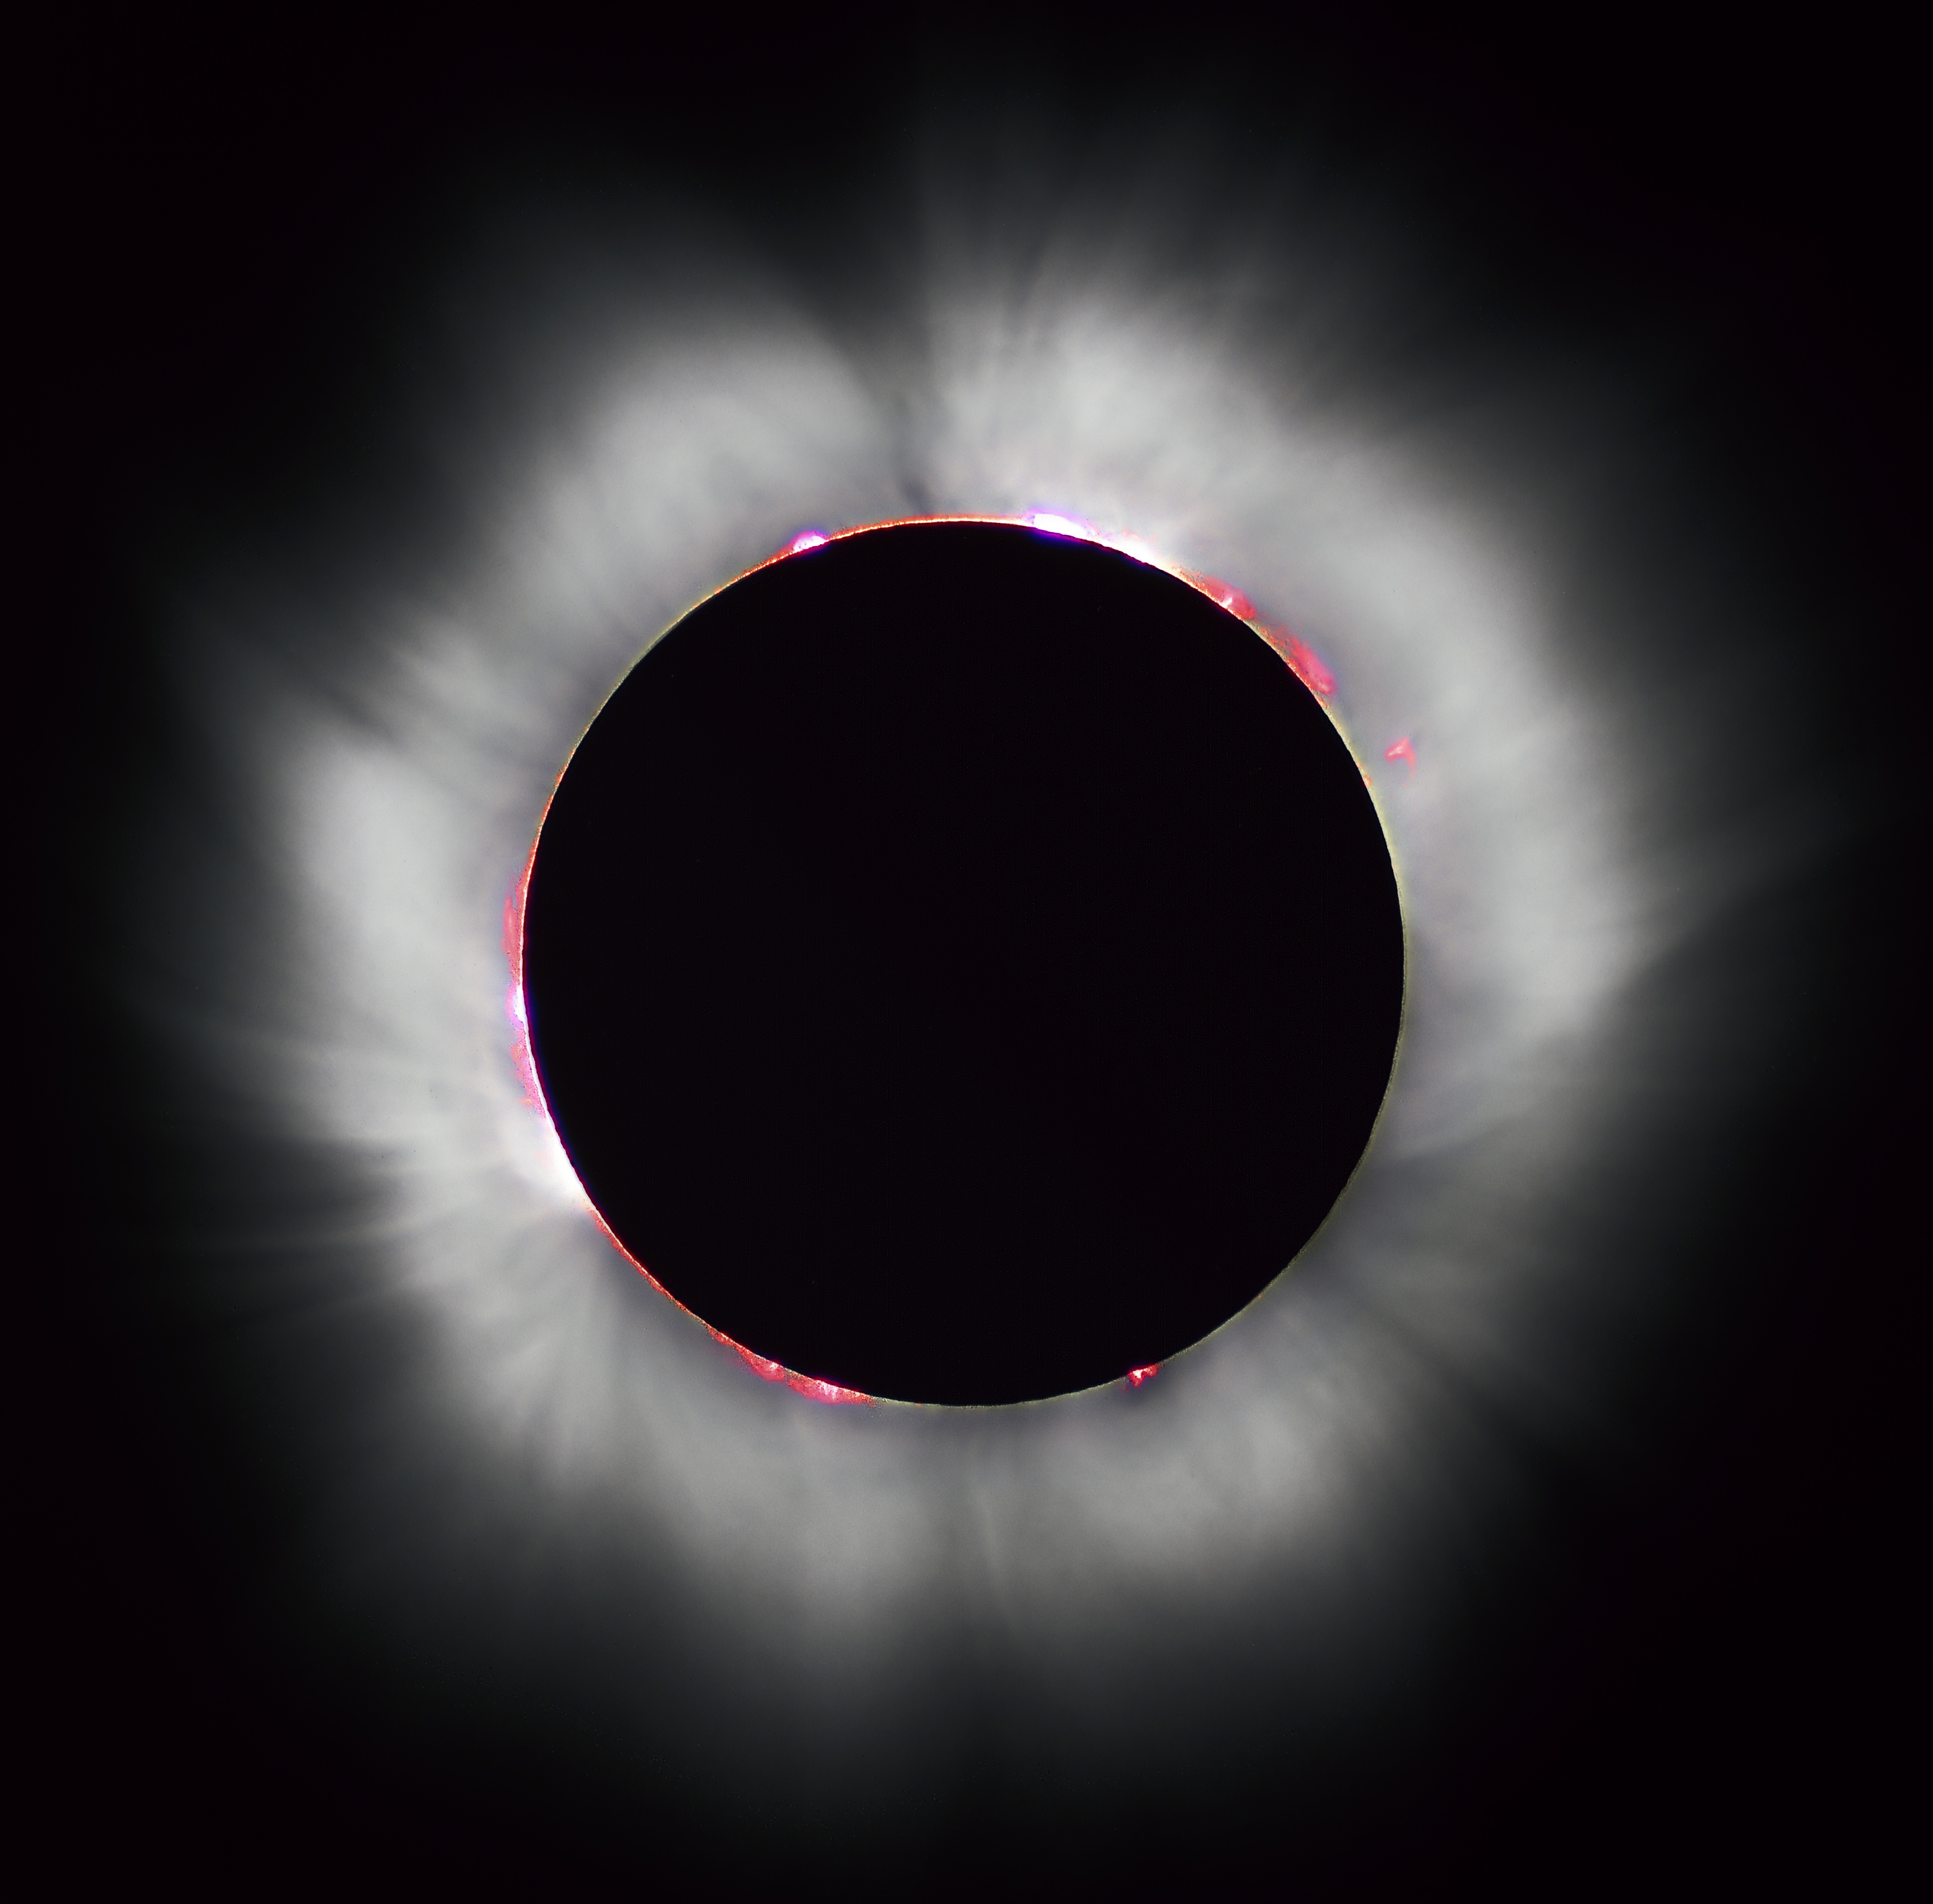
Solar Eclipse
Interestingly, when viewed from the Earth,
the apparent size of the Sun and Moon is almost the same!
Some facts:
- Our Moon is the biggest satellite in the solar system with respect
to the relative size to the mother planet.
Ganimede (5260 km in diameter) v.s. Jupiter (142,000 km, 27 times larger than Ganimede)
-
A solar eclipse from the Mars
(an image from Curiosity, a Mars rover).
-
Solar eclipses from farther outer planets.
- Our moon is moving away from us. (by ~3cm/year)
2. Historical observations of TSEs
Eclipse prediction already existed in B.C. 2000 (China).
Scientific observations of TSEs started since 1842 (use of spectroscope).
Flash spectra : slit-less spectra at the starting/ending moment of
the totality.
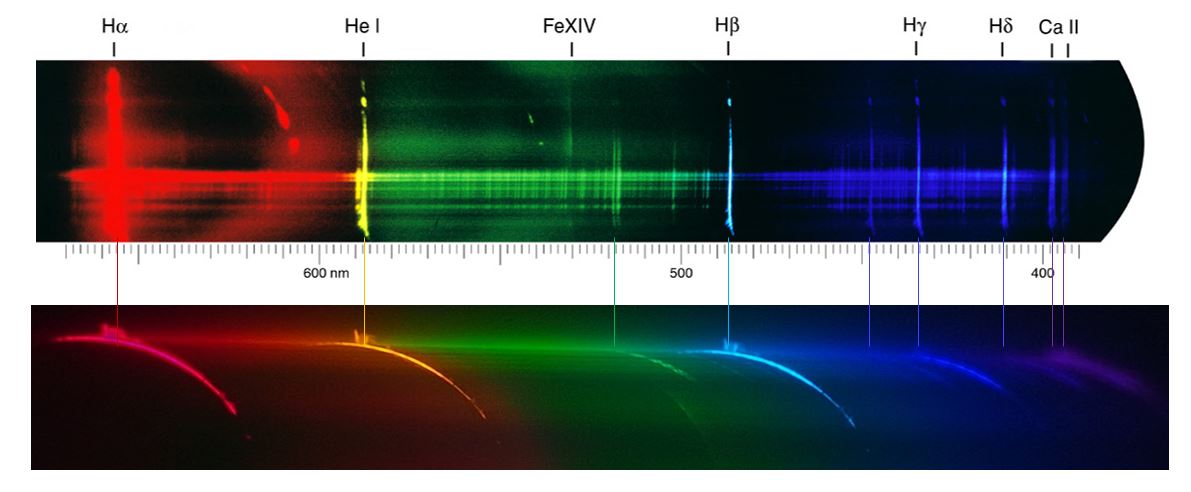
- an unknown yellow line at 587.49nm
- 1868/08/18 (P. Janssen & N. Lockyer): first observed in the Indian eclipse.
- labeled as D3 (near to D1[589.6nm] and D2[589.0nm] lines of Na).
- not corresponding to the line of any known material.
- named as 'Helium' after the Greek Sun god, Helios.
- 1881 (L. Palmieri) : detected D3 line on Earth in volcanic mineral.
- 1895 (W. Ramsay) : first isolated helium on Earth.
27 years since it was first observed.
- an unknown green line at 530.29nm
- 1869/08/07 (C.A. Young & W. Harkness): first observed independently.
- not corresponding to the line of any known material.
- named as 'Coronium' after the solar corona.
- in 1930s, the red line (637.4nm) was identified as
FeX(Fe9+) emission.
- this suggests the solar corona is very HOT
(about 1 MK, much hotter than the photosphere).
- 1940 (W. Grotrian & B. Edlen) : identified the line due to highly
ionized iron (FeXIV, or Fe13+).
71 years since it was first observed.
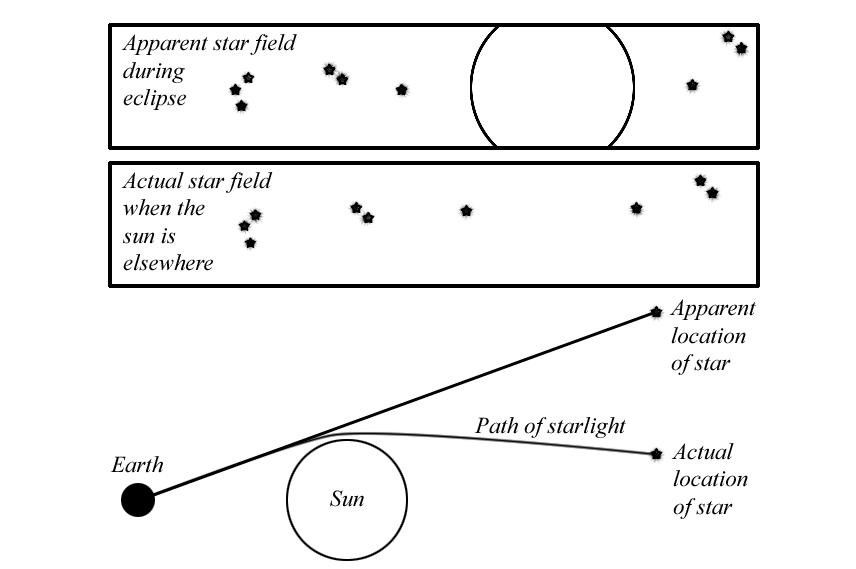
Test of general relativity
- General theory of relativity proposed by A. Einstein in 1915.
- Predicted the deflection of starlight caused by the gravitational
presence of the Sun.
- 1919/05/29 (A. Eddington) : Observation at the island of Principe
(west of Africa) successfully(?) supported the theory.
3. Components of the solar corona.
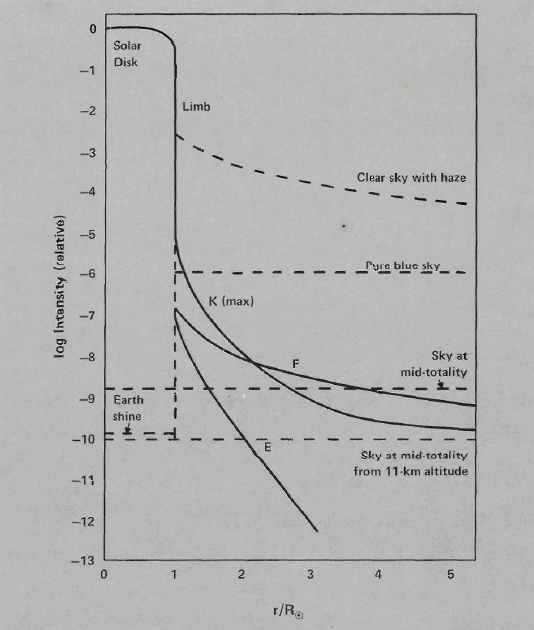
- K-corona : Continuum component
- Thomson scattering of photospheric photons with coronal electrons.
- Fraunhopher
absorption lines are smeared out (due to high Te).
- Intensity is proportional to Ne (electron column density).
- Shows high degree of polarization (~50%).
- F-corona : Photosheric light scattered by the dusts located
at the zodiacal plane.
schematic image
- Holds Fraunhopher lines.
- Not polarized close to the Sun (but starts to polarize
from ~10 Rsol).
- E-corona : true emission from the coronal plasma.
- Most of the emission lines in the visible range are forbidden lines
(against Laporte rule).
- the green line (530.3nm, Fe13+, 2MK)
- the red line (637.4nm, Fe9+, 1MK)
coronal spectrum
- the yellow line (569.4nm, Ca14+, 3MK)
- 789.2nm, Fe10+, 1.2MK
- Excitation mechanism : collision + photospheric radiation.
- Intensity dependence on electron density :
ne1.5-1.7, allowing to observe to higher
altitude (than EUV or X-ray obs, excited by collision).
- Numerous lines in EUV to X-ray ranges,
but you need to go outer space.
- Lines also exist in the IR range (it was hard to observe them
due to lower intensity than visible range, strong absorptions by
atmospheric molecules).
4. Recent observations
Even after the invention of coronagraph (1931, by B. Lyot), TSEs had
been highly important opportunities to observe the corona due to their
extremely low scattered light condition.
Until 1990s when data from space became available, a TSE observation
had been a big scientific project for worldwide astronomers.
4.1 Fine structures of innermost corona.
- Takeda et al. (2000) PASJ, vol.52, p.375
- 1991/07/11 in Mexico.
- target : innermost corona .
(images from
1999 obs. in Turkey).
- photographic observation with Green(530.3nm), Red(637.4nm), Yellow(569.4nm) and the continuum.
- Digitization of film density (by PDS micro-densitometer).
- Transfer the data saved in a magnetic tape to a computer
(Work Station).
- Conversion of film density to intensity (DI-conversion).
- Conversion to the absolute intensity scale
(using partial sun brightness).
- Removal of continuum component from each emission line images.
- Image processing to derive loop structures.
- Calculation of electron densities of emission line loops.
- Compare the loop densities with column densities of continuum corona.
- Showed separate locations of hot(2MK) and cool(1MK) coronal loops,
dominance of 2MK component in the whole corona, etc.
- The research in this field was totally shifted to the use of
space data (!!!).
4.2 Coronal electron temperature and expanding velocity.
- Ichimoto et al. (1996) PASJ, vol.48, p.545
- 1994/11/03 in Chile.
- K-corona spectrum:
week depressions from 390nm to 430nm.
- Derived Te at coronal streamer(1.5-1.7MK) and
a Coronal hole(0.9-1.1MK), from the comparison of the shape of
profile with theory.
- Acceleration of expanding motion by 80km/s at streamer between 1.1 to 2.0 Rsol, from intensity ratio, I3990/I4218.
- Data quality not so good as to derive the velocity at CH (light cloud).
4.3 Exploration with new coronal lines.
- Habbal et al. (2007) ApJ, vol.663, pp.598.
- 2006/03/29 in Libyan Sahara.
- 789.2nm (Fe10+) line full-Sun images for the first time.
- There was technical limitation in photographic imaging at that wavelength.
their 2008 and 2009 observation.
- Habbal et al. (2011) ApJ, vol.734, pp.120.
- 2010/07/11 in Takatoko, French Polynesia.
- Muti-wavelength observation in white light, Ha(656.3nm), FeIX(435.9nm),
FeX(637.4nm), FeXI(789.2nm), FeXIII(1074.7nm), NiXV(670.2nm).
- First ever images of FeIX(0.5MK) and NiXV(2.5MK).
- Separation of collision dominated and collision-less corona,
from the intensity ratio of coronal line images to white light image.
5. 21st August 2017, TSE observations
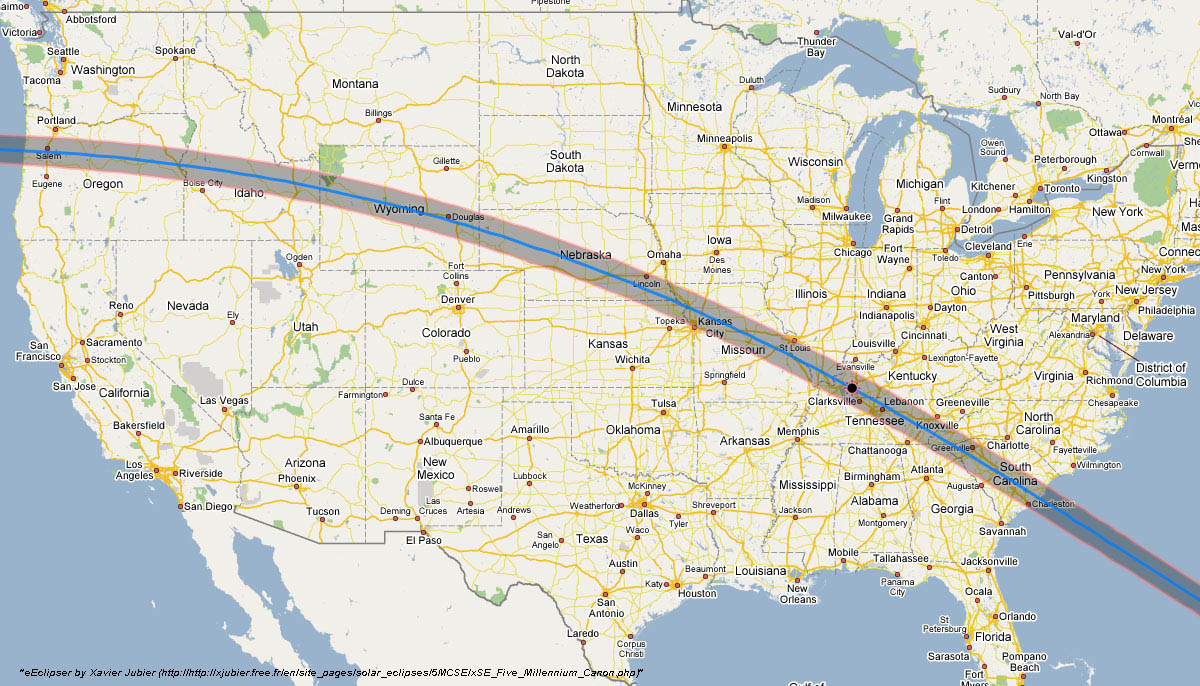
- Polarized brightness of while light corona (MSU group lead by J. Shaw).
- Balloon observation of high altitude atmosphere during totality.
(MSU group lead by MSGC).
- 789.2nm observation (Hawaii Univ. team lead by S. Habbal).
- Airborne Infrared Spectrometer (SAO group).
- IR spectrograph onboard Gulfstream V jet.
- flight altitude ~15km at
SW Kentucky
- clear most of atmosphere,
minimal IR absorption from water molecules.
- 4 min duration in the air (~2 min on the ground).
- with image stabilizer.
- 5 IR lines (SiX 1.43, S XI 1.92, Fe IX 2.86, Mg VIII 3.03,
Si IX 3.94 um), with magnetic sensitivity
(finding candidates of future coronal magnetic field obs.).
6. Summary
- Importance of TSE observation was reduced due to the availability of
data from space.
- TSEs can still provide scientifically valuable data.
- White light innermost coronal images under best weather condition
are never obtained with other methods.
- Good photometrical images in traditional coronal lines are
valuable for the study of long-term variation
(we may count on amateur astronomers, or students' project).
- Thanks to technological development (good detectors and
narrow band filters), new experimental or challenging
observations are being tried.
