Solar Soft X-ray Irradiance (1991-2001) Derived from
Yohkoh/SXT
Aki Takeda (Montana State Univ.), Nicole Albanese (Tufts Univ.) and
Loren Acton (MSU)
0. Summary
Solar soft X-ray irradiance (3-45A) was calculated using the mission-long
Yohkoh/SXT full-Sun images (1991-2001) obtained with two analysis
filters (thin-Al and Al/Mg/Mn). We applied the most recent results
of the re-calibated SXT effective area functions (see sub-section 1.2
and section 3) to this calculation. We assumed so-called, 'hybrid'
elemental abundances by Schmeltz (2012).
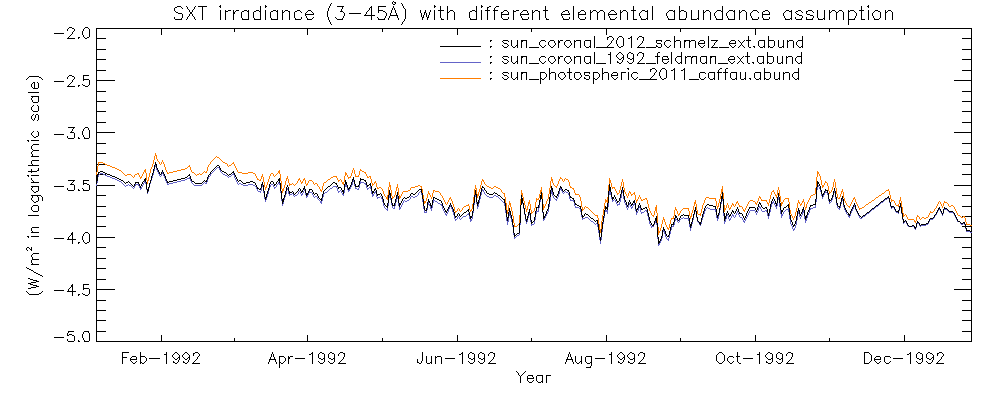
It turned out that the 'coronal' and 'photospheric' abuncances provide
~10% lower and ~25% higher values, respectively, than the hybrid
abundance.
SXT irradiance calculated in 1-10A shows best correlation with GOES/XRS,
especially when the flux level is around 10^7 W/m^2 (see Fig. 6).
This indidates that SXT's 1-10A irradiance is useable as the correction
of GOES/XRS irradiance around the solar minimum (1995-1998).
Fig. 1 (top left): Yohkoh/SXT irradiance for 1991-2001 in 3-45A.
Fig. 2 (middle left): Filter-ratio temperatures derived from the
thin-Al and Al/Mg/Mn filter pairs.
Fig. 3 (bottom left): Filter-ratio emission measures derived from
the thin-Al and Al/Mg/Mn filter pairs.
Fig. 4 (top right): Yohkoh/SXT irradiance calculated in 1-8A.
Fig. 5 (middle right): GOES/XRS 1-8A flux for 1991-2001 from
YLA seamless GOES data archive.
Fig. 6 (bottom right): Comparison of SXT irradiance with GOES/XRS.
1. Introduction
1.1 Yohkoh/SXT and the YLA
- Yohkoh (Japanese word for 'sunshine') is a Japan/US/UK mission
for high-energy solar physics (1991-2001).
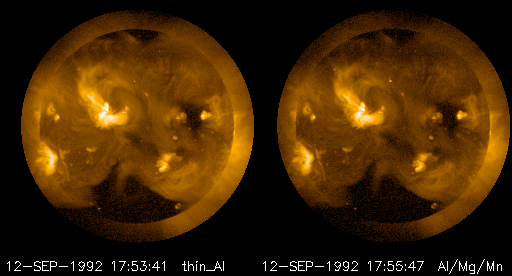
- SXT(Soft X-ray Telescope) is
a grazing incidence telescope
on-board the Yohkoh satellite to form X-ray images in the 3 to 45A range
on a 1024x1024 CCD.
- All usable dataset from the Yohkoh mission (from raw level to highly
calibrated) are accessible from the Yohkoh Legacy data Archive (YLA) at
http://www.solar.physics.montana.edu/ylegacy .
1.2 Most recent calibration on SXT effective area function
A significant decrease of the signal level of SXT's aspect sensor
(visible telescope) was observed for the first 14 months after the
launch of the satellite (see Fig. 8, left plot).
It was long considered only affect visible light signals, and not
affect the X-ray signals. However, the variation of the total coronal
emission measures shows artificial dip that is not related to the
solar activity. To correct this, Acton (2018) introduced the
accumulation of some material(evaporated from the telescope body)
on the outer surface of SXT (that affect aspect sensor and pre-filter).
Acton(2018) assumed the material contains Cabon, and estimated the
growth rate of the carbon layer that explains the decrease of the
visible light signals. The transmission of the pre-filter was
modified using the same accumulation rate, and propagated to the
SXT effective area function.

1.3 Seamless GOES/XRS data archive
- Seamless GOES/XRS data (1991-2001) are prepared by the YLA team.
They are essentially composite data from the primary GOES satellite
of the time.
- The missing-data periods (eclipses, etc.) of the primary satellite
were replaced as much as possible with those of the secondary satellite.
- The
scaling factors applied by SWPC to the archived flux were corrected
(removed) to get true fluxes for 1991-2001.
2. Data Processing
The Yohkoh Legacy data Archive (YLA) provides the mission-long SXT
full-sun composite images as SXT level_2 data. Data were processed
with the following steps.
- Step 1 : Find pairs of thin-Al and Al/Mg/Mn filter images taken
close in time (< 5 min. apart) and review for quality check.
- Step 2 : Collect coronal intensities within 1.2Rs to obtain
full-sun integrated signal pairs from each pair of images.
- Step 3 : Derive filter-ratio temperature and emission measure
from each signal pairs.
- Step 4 : Isothermal coronal spectra is calculated from the
derived temperatures and emission measures, using CHIANTI atomic DB and
software (ver. 8.0.7).
- Step 5 : Integrate obtained spectrum over SXT's effective spectral
range (3-45A) or other desired range (e.g. 1-8A) to derive coronal
irradiance in the unit of W/m^2.

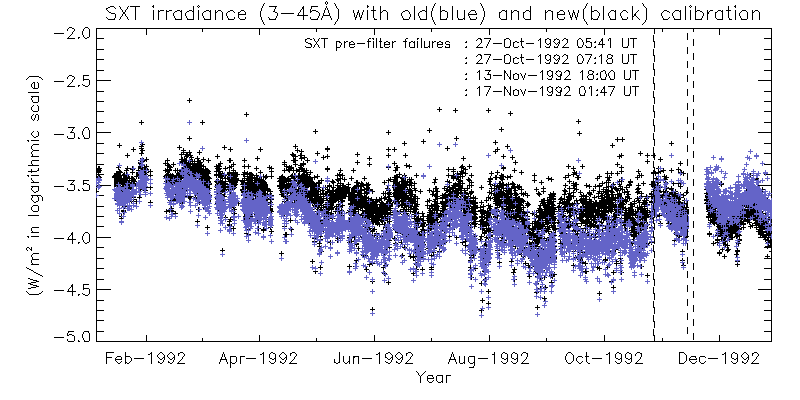
3. Comparison of Old and New Calibration
Fig. x shows the SXT irradiance for 1992 derived with old and new
SXT effective area functions. The difference is the largest for the
period until the first pre-filter failure on 27-Oct-1992.

4. Assumption of Elemental Abundances
Our calculation assumes the elemental abundances by Schmelz et al.
(2012), which is so-called 'hybrid' aboundance set.
We also tried other abundance assumptions : so-called 'coronal'
abundance by Feldman (1992) and 'photospheric' abundance by
Caffau et al.(2011). It turned out that the coronal and phospheric
abundance sets provide ~10% lower and ~25% higher values, respectively,
than the hybrid abundance set.

5. Comparison with GOES/XRS
The derived temperatures and emission measures allow us to calculate
the soft X-ray irradiance in other wavelength range. We calculated
the irradiance in the 1-8A range (Fig. 4) to compare with the data
from GOES/XRS low band flux (Fig. 5). It turned out that :
- SXT irradience in 1-8A is generally ~3 times lower than that of
GOES/XRS, except the period of around the solar minimum (1995-1998)
when the GOES/XRS flux went under the detection level.
- SXT irradiance in 1-10A shows better correlation with GOES/XRS,
especially when the flux level is around 10^7 W/m^2 (see Fig. 6).
These indidate that SXT's 1-10A irradiance is useable as the correction
of GOES/XRS irradiance around the solar minimum (1995-1998).
References
- Acton, L. W. (2018) submitted to Solar Physics.
- Feldman, U., Mandelbaum, P., Seely, J.F., Doschek, G.A., Gu
rsky, H. (1992) Astrophys. J. Suppl. 81, 387.
- Schmelz, J.T., Reames, D.V., von Steiger, R., & Basu, S. (2012),
ApJ, 755, 33.
- Caffau, E., Ludwig, H.-G., Steffen, M., Freytag, B. & Bonifacio, P.
(2011), Sol. Phys. 268, 255.


