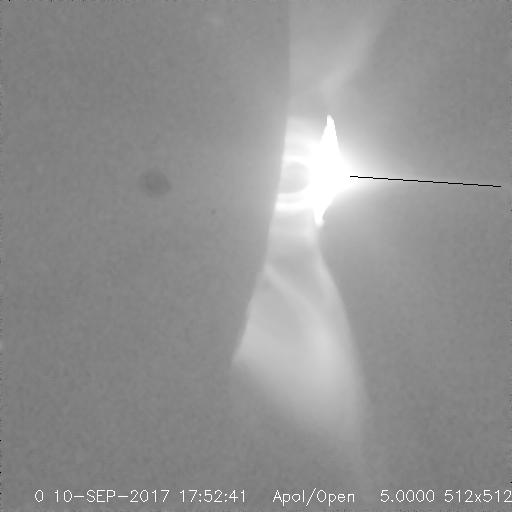
Current sheet study of the 10-Sep-2017 X8.2 flare
Aki Takeda, 9-Oct-2018.
added comments from Keiji and Chunming in red, 16-Oct-2018.
Introduction
This flare was well observed by XRT:
- GOES/XRS class: X8.2 (09/10 15:35 -- 16:06 -- 16:31)
- XRT flare mode triggered: 15:40:47 -- 16:17:29)
- GOES flux level was C2.5 at the start of flare mode at 15:40:47.
- However, the detection of flare site was failed because of
saturation patterns, etc.
Current Sheet Observation
This study was inspired by Dana Longscope's recent paper, using AIA
observation of the current-sheet like strucutre from this flare.
The goel of this study is to determine Te and EM of the current sheet
from the corresponding XRT images.
raw data set.
5 images running summation.
Applying TEEM
Our official XRT_TEEM only accepts data before intensity normalization.
In order to apply TEEM with our superposed images, we had to tweet
(or cheat) the program like this:
index_ap.exptime=5.0      ; give exposure time of summed image.
index_tb.exptime=5.0      ; give exposure time of summed image.
index_ap.history(17)=' '  ; cheat TEEM by hiding int. normalization.
index_tb.history(17)=' '  ; cheat TEEM by hiding int. normalization.
data_ap=median(data_ap,5)
data_tb=median(data_tb,5)
;
xrt_teem_ch800,index_ap,data_ap,index_tb,data_tb,te5,em5
In order for uncertainty analysis, data after
PREP without intensity normalization should be added up, then
change the index.exptime to the total exposure time of the image
summed.
Remember the main source of uncertainly is photon noise, and it
should be calculated with the true DN collected by summation.
- a single exposure image (click image to enlarge):
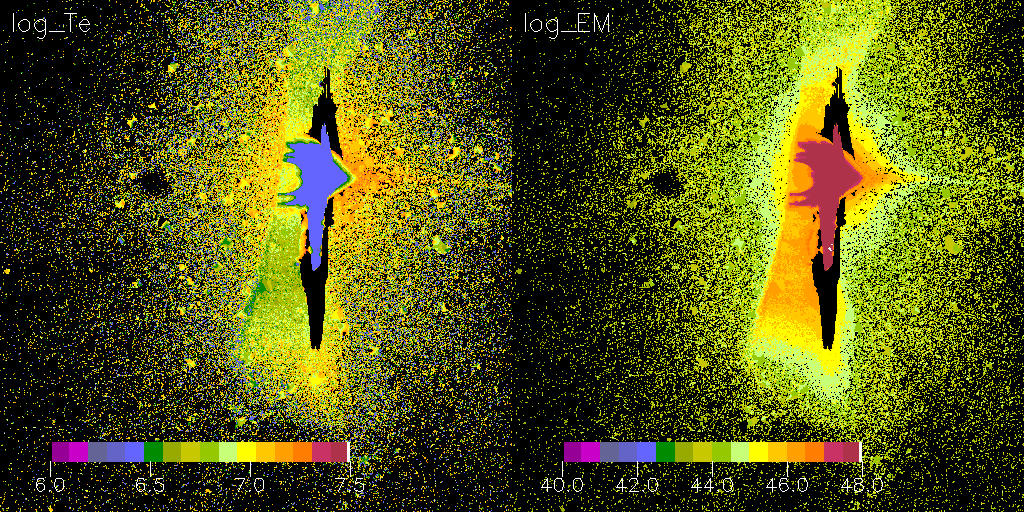
- a single exposure image with 5-pix median (click image to enlarge):
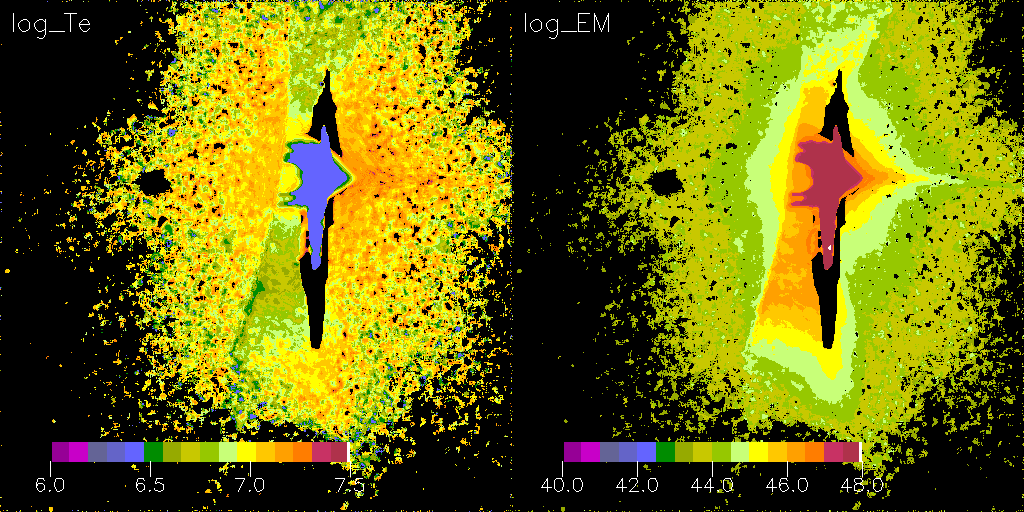
- 5-image summation with 5-pix median (click image to enlarge):
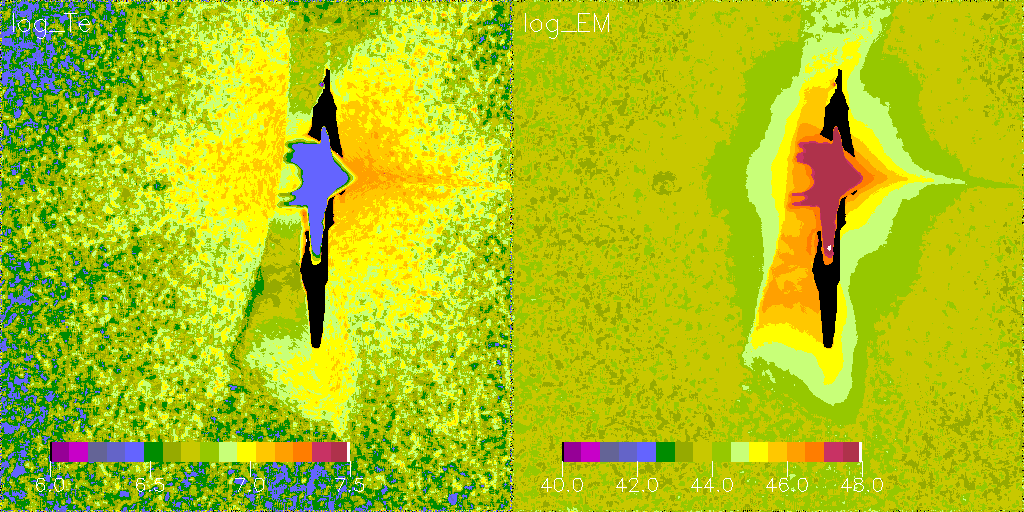
- 10-image summation with 5-pix median (click image to enlarge):
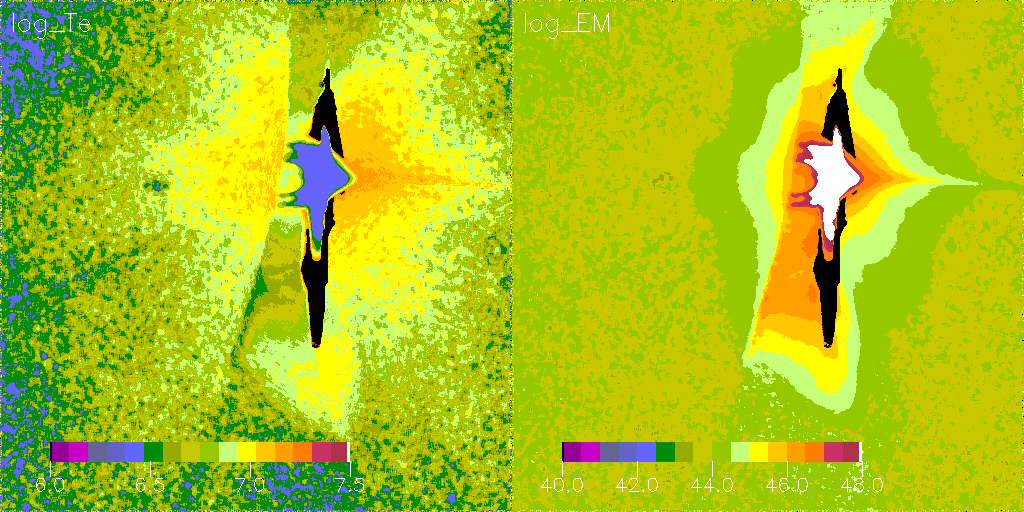
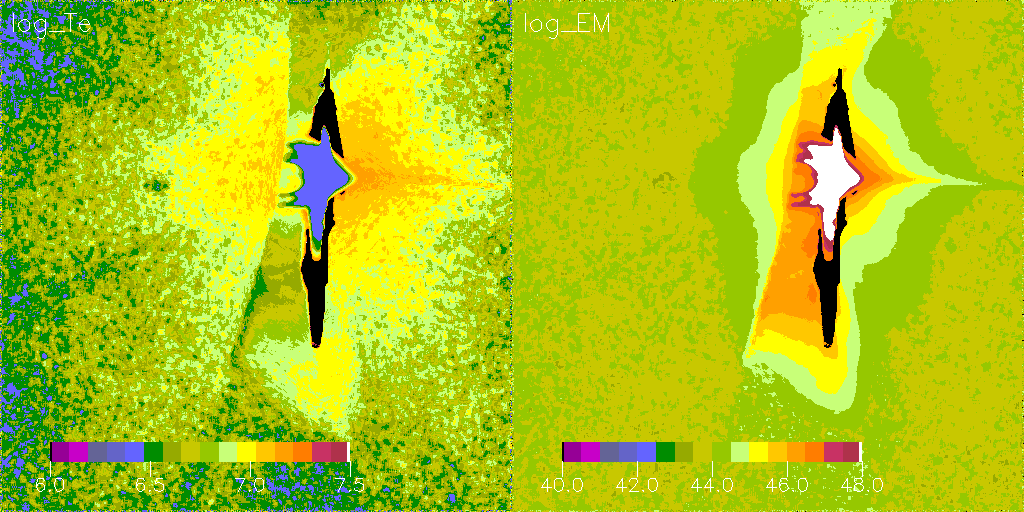
- 10-image summation with 5-pix median
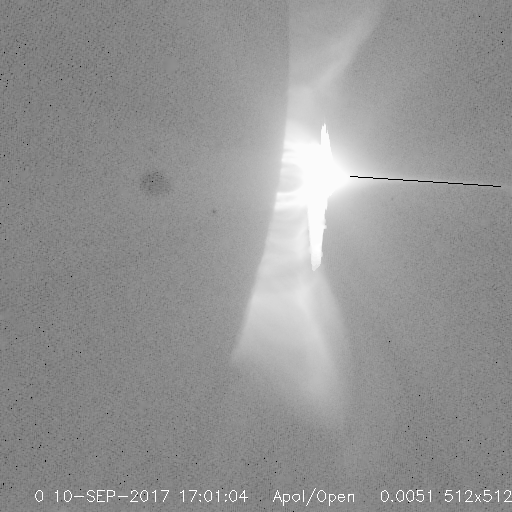
(Al_poly stray light subtracted): (click image to enlarge)
Te and EM Profile along CS
Te and EM profiles are made along the current sheet (black line).
Te and EM images used for these profiles are :
- 5-image summed data (white),
- 10-image summed with stray-light corr (orange), and
- 10-image summed without stray-light corr (green) -- hardly seen.
The background subtaction will significantly
affect the result ....
(click image to enlarge)
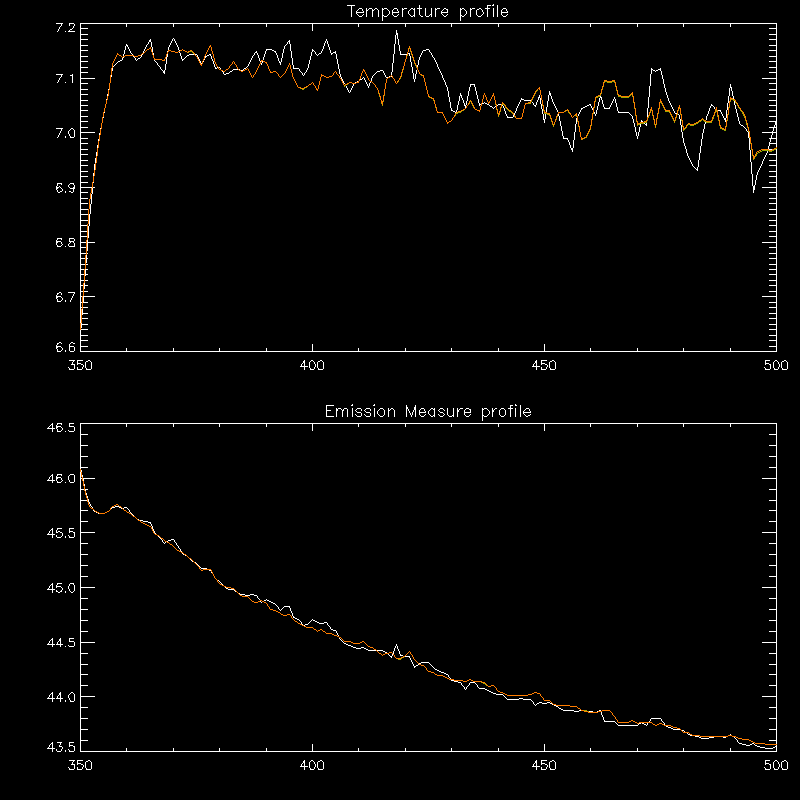
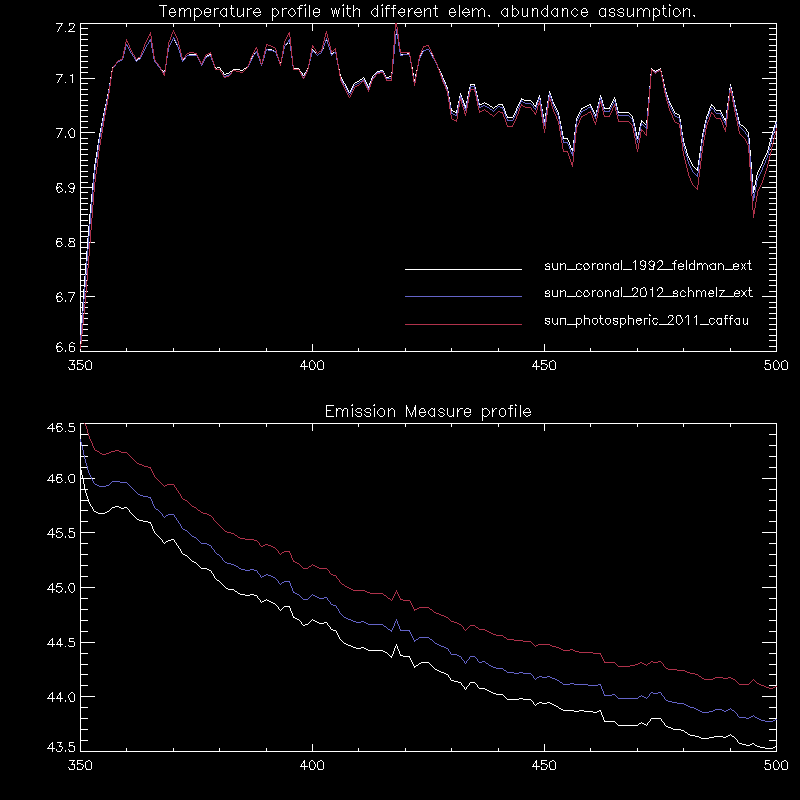
- Additional study on the choice of elemental abundances.
(click image to enlarge)
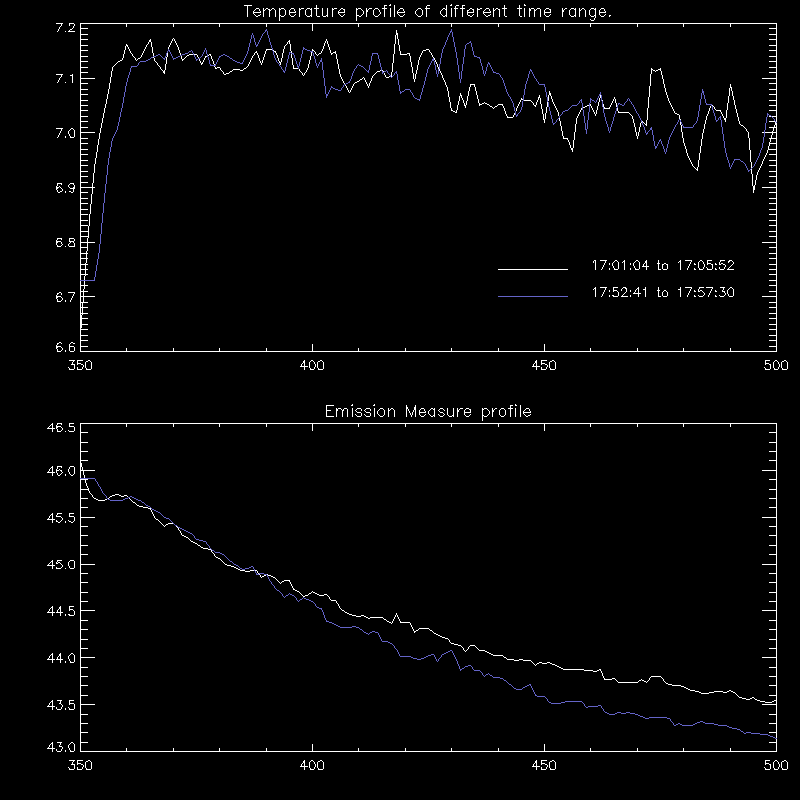
- Additional study on the time variation.
While the slope of EM becomes steeper with time, Te does not vary much in about 1 hour.
(click image to enlarge)
